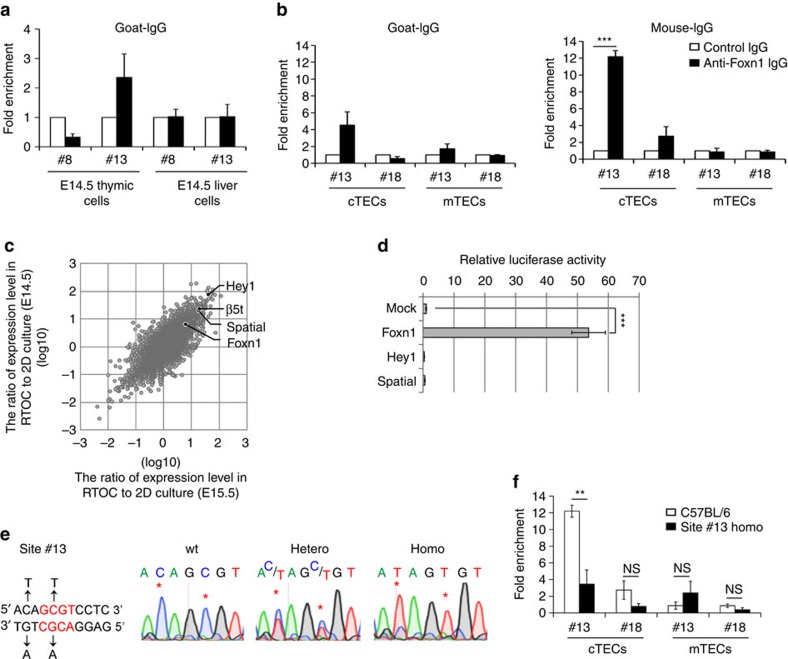
Figure 3. Generation of site #13 mutant mice.
(a) Thymuses and livers isolated from E14.5 embryos were liberase-digested. Protein–DNA complexes were immunoprecipitated with goat anti-Foxn1 antibody (filled bars) or control IgG (open bars) and PCR-amplified for site #8 or site #13. Graph shows fold enrichment (means±s.e.m., n=9) of anti-Foxn1-precipitated signals normalized to the signals by control IgG. (b) CD45−CD326+UEA1−CD249+ cTECs and CD45−CD326+UEA1+CD249− mTECs were isolated from 2-week-old C57BL/6 mice. Protein–DNA complexes were immunoprecipitated with anti-Foxn1 antibody (filled bars) or control IgG (open bars) and PCR-amplified for site #13 or site #18. Graph shows fold enrichment (means±s.e.m., n=3) of anti-Foxn1-precipitated signals normalized to the signals by control IgG. ***P<0.001. (c) Comparison of gene expression profiles between RTOC and 2D culture of thymic stromal cells from E14.5 and E15.5 mice by microarray analysis. Grey dots represent ratios (log scale) of gene expression levels (33,749 transcripts) in the two culture conditions. Longitudinal and horizontal axes show the ratios in E14.5 and E15.5 thymic stromal cells, respectively. (d) A plasmid encoding Foxn1, Hey1 or Spatial was transfected into HEK293T cells together with a firefly luciferase that contained the 7-kb β5t 5′-flanking region and a control plasmid encoding Renilla luciferase. Intensities of firefly and Renilla luciferase activities were measured 48 h after transfection. Histograms represent relative luciferase activity, where the activity in mock transfection was set as 1. All data are shown as means±s.d. (n=3). ***P<0.005. (e) Mutant mice carrying the mutation in site #13 proximal to β5t-encoding gene were generated by the CRISPR/Cas9-mediated genome editing technology. The 2-bp mutation at site #13 (left) was confirmed in wild-type (wt), heterozygous, and homozygous mutant mice (right). (f) cTECs and mTECs were isolated from 2-week-old site #13 homozygous mutant mice. Graph shows fold enrichment (means±s.e.m., n=3) of mouse monoclonal anti-Foxn1-precipitated signals normalized to the signals by control IgG (filled bars) and comparison to the value in TECs isolated from C57BL/6 mice (open bars) as shown in b. **P<0.01; NS, not significant. All statistical analyses were performed by student's t-test.

