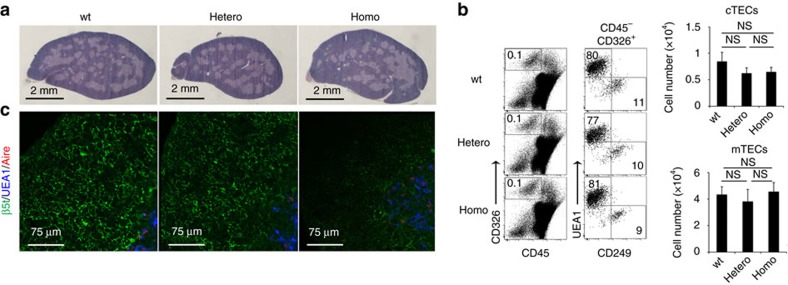
Figure 4. Diminished β5t expression in thymus of site #13 mutant mice.
(a) Haematoxylin and eosin staining of thymic sections from 2-week-old mice. Representative data from three independent experiments are shown. Scale bar, 2 mm. (b) Flow cytometric analysis of liberase-digested thymic cells isolated from 2-week-old mice. Dot plots show CD326 and CD45 expression in total thymic cells (left), and UEA-1 reactivity and CD249 expression in CD45−CD326+-gated epithelial cells (middle). Bar graphs show cell number (means±s.e.m., n=4) of CD45−CD326+UEA1−CD249+ cTECs and CD45−CD326+UEA1+ CD249− mTECs. NS, not significant. Statistical analyses were performed by student's t-test. (c) Immunofluorescence analysis of β5t (green), Aire (red) and UEA-1-binding molecules (blue) in thymic sections from 2-week-old mice. Representative data from three independent experiments are shown. Scale bar, 75 μm.

