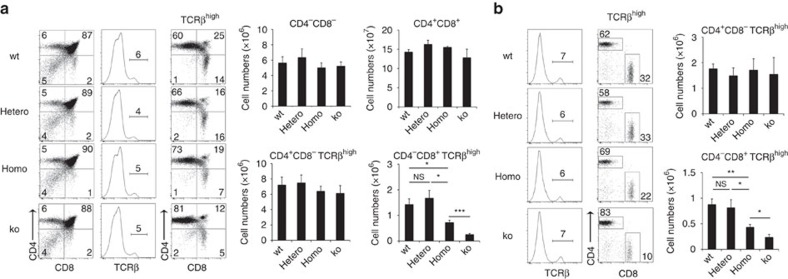
Figure 6. Defective CD8+ T cell production in site #13 mutant mice.
(a) Flow cytometric analysis of thymocytes from 2-week-old mice. Shown are dot plots for CD8 and CD4 expression (left) and TCRβ expression (middle) in PI- viable cells and dot plots for CD8 and CD4 expression in PI- TCRβhigh cells (right). Bar graphs show cell numbers (means±s.e.m., n=4–6) of indicated thymocyte populations. (b) Flow cytometric analysis of splenocytes from 2-week-old mice. Histograms show TCRβ expression in PI- viable cells. Dot plots show CD8 and CD4 expression in PI- TCRβhigh cells. Bar graphs show numbers (means±s.e.m., n=4–6) of CD4+CD8−TCRβhigh T cells and CD4−CD8+TCRβhigh T cells. Numbers in dot plots and histograms indicate frequency of cells within indicated area. *P<0.05; **P<0.01; ***P<0.001; NS, not significant. Statistical analyses were performed by student's t-test. See also Supplementary Fig. 2c,d.

