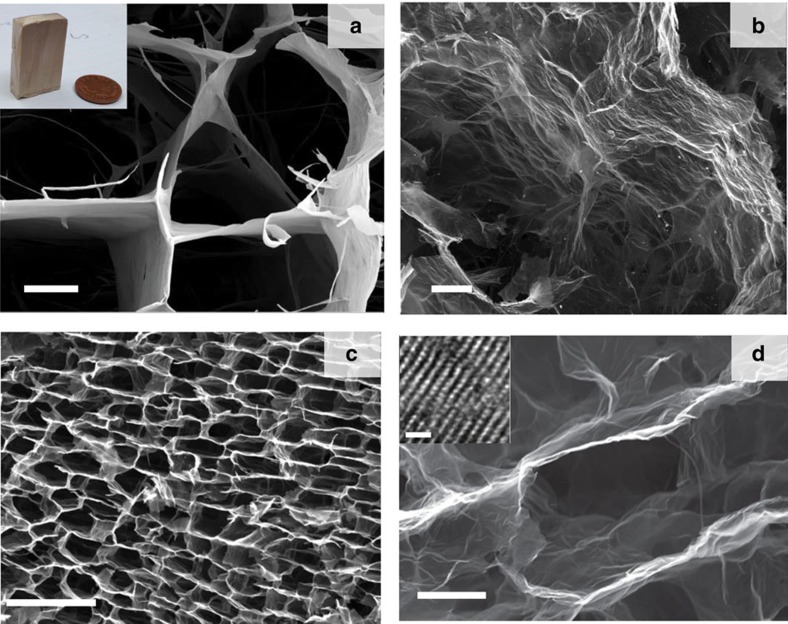
Figure 1. CMG networks.
Scanning electron micrographs of the CMG network (taken using secondary electrons) (a) before and (b–d) after thermal reduction. The inset in a shows the sample size. The images a and b were taken in the plane perpendicular to the direction of ice growth during freeze casting, while c and d were taken in the parallel plane. Comparison of a and b shows that thermal reduction results in wrinkling and roughening of the network walls, while the comparison of a and d illustrates the shrinkage or the cells. The network shows large scale ordering (c) retaining very thin walls after reduction (d). The inset in d shows a high-resolution transmission electron micrograph of the cross section of one of the network walls showing the stacking of the carbon layers. Scale bar, 10 μm (a) and (b); 100 μm (c); 5 μm (d); 10 Å (d) inset.

