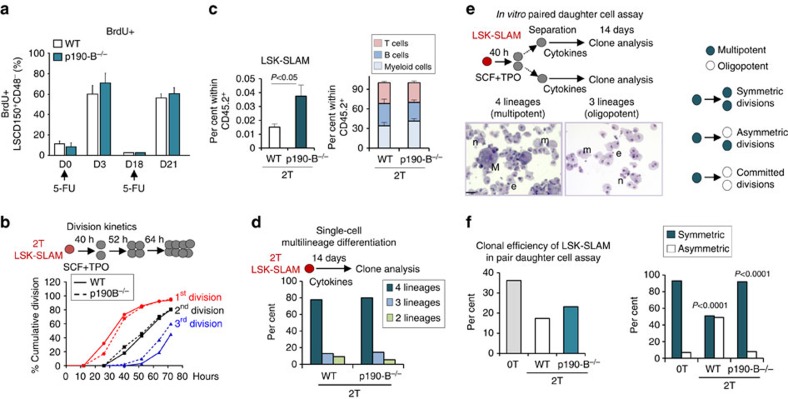
Figure 1. p190-B regulates HSC self-renewal independent of proliferation.
WT and p190-B−/− fetal liver cells were used for serial competitive transplantation as in ref. 19. (at least two independent experiments) (a) BrdU incorporation was performed in secondary transplanted (2T) WT and p190-B−/− mice challenged with 5-FU at indicated timeto examine HSPC proliferation. BM was harvested 18 h after BrdU treatment at each time point, stained and analysed by flow cytometry (mean±s.e.m.; n=5 mice per group). (b) Cell division kinetics. Single LSK-SLAM cells from 2T-WT and 2T- p190B−/− transplanted mice were isolated. Cells were counted every 12 h to determine division kinetics (n=75–100 cells per group from three independent experiments). (c) Frequency of LSK-SLAM and per cent lineage reconstitution in BM of 2T mice with WT and p190-B−/− cells, 4 months post-transplant. (mean±s.e.m.; n=7 mice per group). (d) Single cell multilineage differentiation assay. Single LSK-SLAM cells were isolated and cultured with serum and multiple cytokines to induce terminal myeloid differentiation, for 14 days. Bar graphs show per cent of clones containing 4, 3 and 2 lineages initiated from LSK-SLAM cells (n=50–60 clones per group). (e,f) In vitro paired daughter cell assay of single LSK-SLAM cells isolated from control (0T, non-transplanted cells) and 2T-WT and 2T- p190-B−/− mice. Paired-daughter cells were separated and further cultured individually with serum and multiple cytokines to induce terminal myeloid differentiation, for 14 days. (e) Schema of the assay; images illustrate an asymmetric division with one multi-potent clone containing four myeloid lineages (e: erythroid cells, n: neutrophils, m: macrophage/monocyte, M: megakaryocyte), and the daughter clone containing only three lineages (n,e,m), scale bar, 20 μm. (f) Left bar graph shows per cent of cloning efficiency of single cells generating paired-daughter clones; bar graph on the right shows relative frequency of asymmetric and symmetric progenitor divisions calculated from cells generating at least one multipotent daughter cell (n=35–55 pairs per group from three or more independent experiments). P values were calculated by Fisher exact 2 × 2 contingency table by comparing percent of symmetric and asymmetric divisions of the following groups: 2T-WT versus 0T and 2T-p190-B−/− versus 2T-WT.

