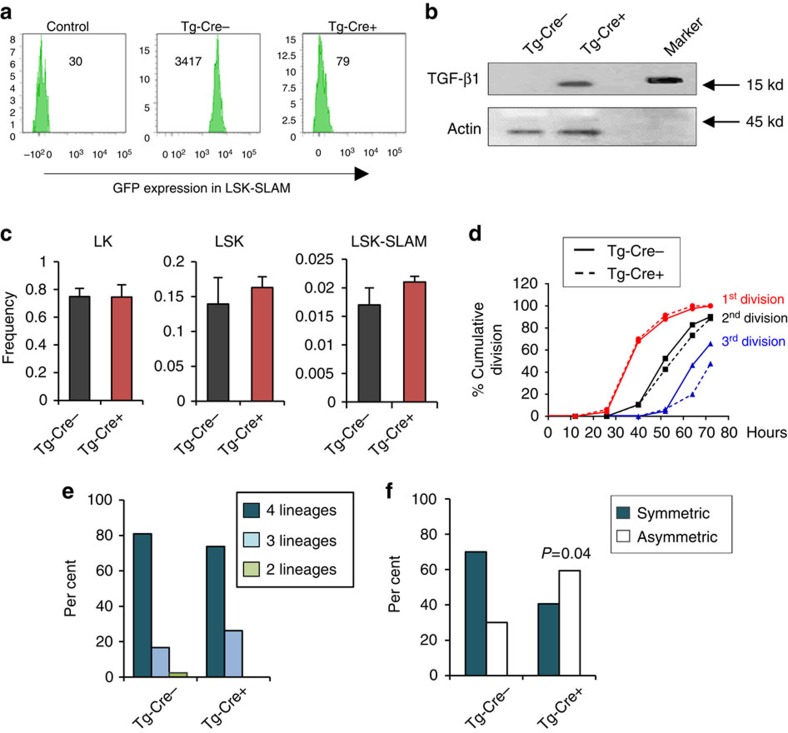
Figure 6. Over expression of aTGF-β promotes HSPC differentiation.
Mice. transgenic for MxCre+/Flox-EGFP-STOP-aTGFb [Tg-Cre+] and MxCre-/Flox-EGFP-STOP-aTGFb [Tg-Cre−] were analysed 3–4 weeks after poly-IC injection. All data are from at least 2 independent experiments. (a) Histograms of flow cytometry analysis of EGFP expression in LSK-SLAM cells. (b) Western blot analysis of LSK cells showing overexpression of aTGF-β (expected size for aTGF-β is around 15–20 kd). Actin was used as an isnternal control. (c) Bar graphs show frequency of LSK-SLAM, LSK and LK population in BM (mean±s.e.m.; n=9 mice per group). (d) Cell division kinetics. Single LSK-SLAM cells from each group were cultured with medium containing SCF+TPO. Wells were examined every 12 h to determine division kinetics (n=30–50 cells per division per group, two independent experiments). (e) Single cell multilineage differentiation assay of LSK-SLAM cells isolated from each group. Single cells were isolated and cultured with serum and multiple cytokines to induce terminal myeloid differentiation, for 14 days. Clones were analysed as in Fig. 1. Bar graph shows per cent of clones containing 4, 3 and 2 lineages (n=40–80 clones per group, two independent experiments). (f) In vitro paired daughter cell assay performed with LSK-SLAM cells. Single LSK-SLAM cells were cultured with SCF+TPO for one division. Daughter cells were separated and further cultured individually with serum and cytokines to assess multilineage differentiation potential of daughter cells, as in Fig. 1. Bar graph shows frequency of asymmetric and symmetric divisions (n=20–30 pairs per group, two independent experiments). P value was calculated using fisher exact 2 × 2 contingency table.

