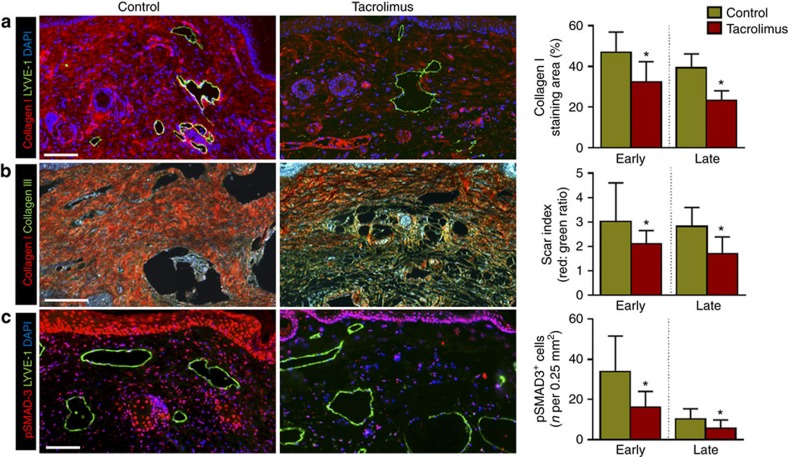
Figure 3. Topical tacrolimus decreases fibrosis in lymphedema.
(a) Representative × 40 images of tail tissues from control or early tacrolimus-treated mice 6 weeks after surgery with immunofluorescent localization of type I collagen (red) and lymphatic vessels (green). Quantifications of the percent area of collagen I staining in both early and late treatment are shown to the right (P<0.001 for both; n=8/group). (b) Representative × 40 images of picrosirius red staining of tail tissues harvested from control or early tacrolimus-treated animals (red-orange birefringence represents collagen I deposition; green-yellow birefringence represents collagen III deposition). Quantification of Scar Index (red: green ratio) is shown to the right (P=0.036 early; P<0.001 late; n=8/group). (c) Representative × 40 immunofluorescent co-localization of pSMAD-3 (red) with lymphatic vessel (green) in tail tissues harvested from animals treated with control or early treatment with tacrolimus 6 weeks after surgery. Quantification of the number of positive cells per 0.25 mm2 area (four random areas per mouse) for both is shown to the right of (P=0.002 early, P=0.026 late; n=8/group). Experiments were repeated two to three times. All data represent mean±s.d. with P≤0.05 considered as significant. Data analysed by two-tailed Student's t-test. Scale bars, 100 μm.

