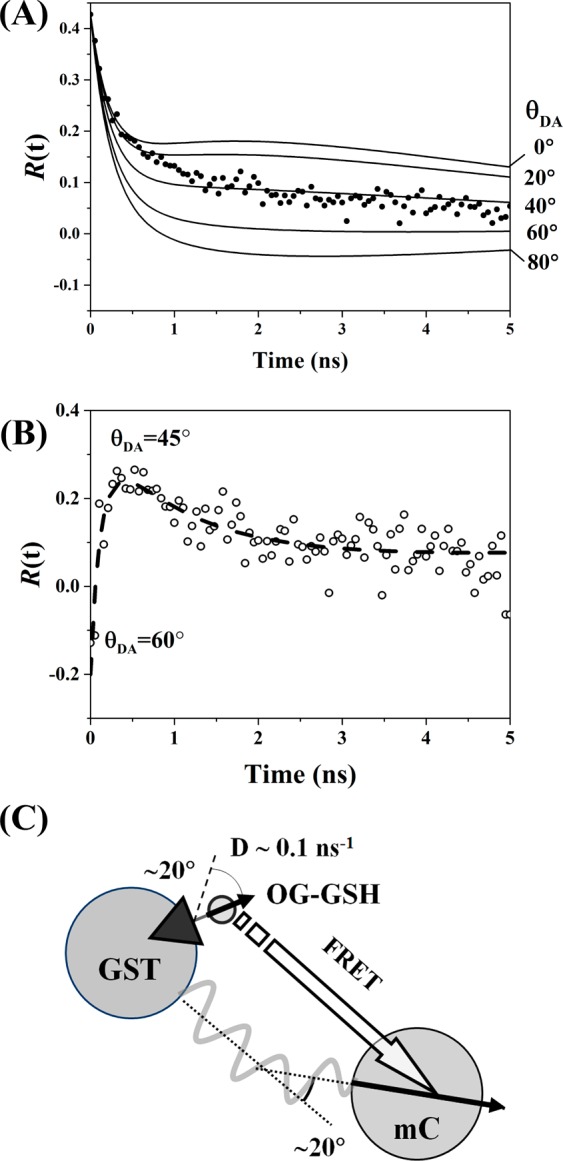
Figure 6.

(A) Fluorescence anisotropy decay of a mixture of 60 μM OG-GSH and 30 μM GST-mC with 880 nm excitation and detection in the acceptor window (630–650 nm). The fixed dipole angle model cannot be fit to the data with χR2 minimized at an unacceptable value of 3.05 with θDA ∼ 40°. (B) Predicted form of the intrinsic acceptor anisotropy by subtraction of the calculated donor bleed through from the composite anisotropy measured in (A). The initial rise, plateau, and decay imply a time-varying θDA consistent with the measured orientational freedom of both the donor and acceptor. (C) Schematic structure of the OG-GSH-GST-mC complex, the negative initial anisotropy recovered in (B) implies a close to 60° value for θDA.
