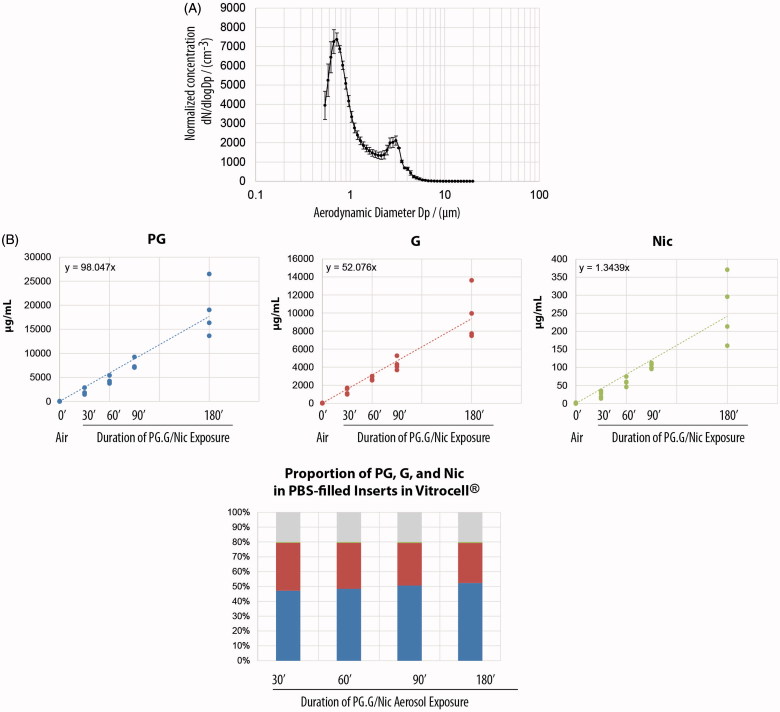
Figure 14.
Particle size distribution of the aerosols and depositions in the Vitrocell base module. A, The droplet size distribution of the aerosol generated using the Collison nebulizer (N = 3). Error bars indicate the standard error of the mean. B, Concentrations of PG, G, and Nic in the PBS-filled inserts placed in the Vitrocell base module after exposure to the test aerosols for 30, 60, 90, or 180 min (upper panels). The proportion of PG, G, and Nic in the PBS-filled inserts after they were exposed to the test aerosols for the various exposure durations (lower panel). Abbreviations: G: glycerol; Nic: nicotine; PG: propylene glycol.

