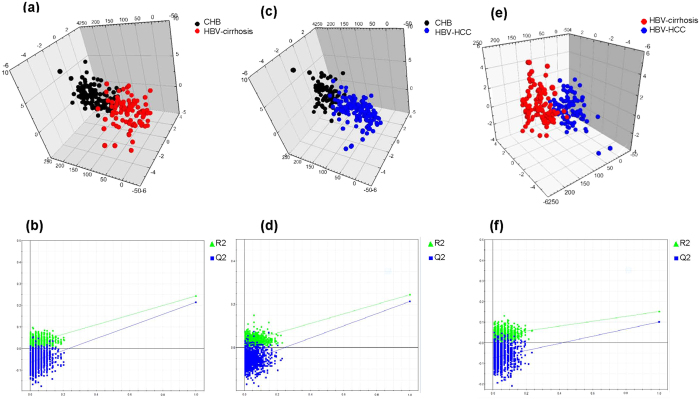
Figure 2. 3D PLS-DA Score plots show clear separation within each two groups based on the selected 9 representative variables.
CHB versus HBV-associated cirrhosis: (a) PLS-DA scores plot: R2X = 0.564 R2Y = 0.243 Q2 = 0.214. (b) Permutation analysis. CHB versus HBV-associated HCC: (c) PLS-DA scores plot: R2X = 0.569 R2Y = 0.244 Q2 = 0.212. (d) Permutation analysis. HBV-associated cirrhosis versus HBV-associated HCC: (e) PLS-DA scores plot: R2X = 0.548 R2Y = 0.152 Q2 = 0.101. (f) Permutation analysis.

