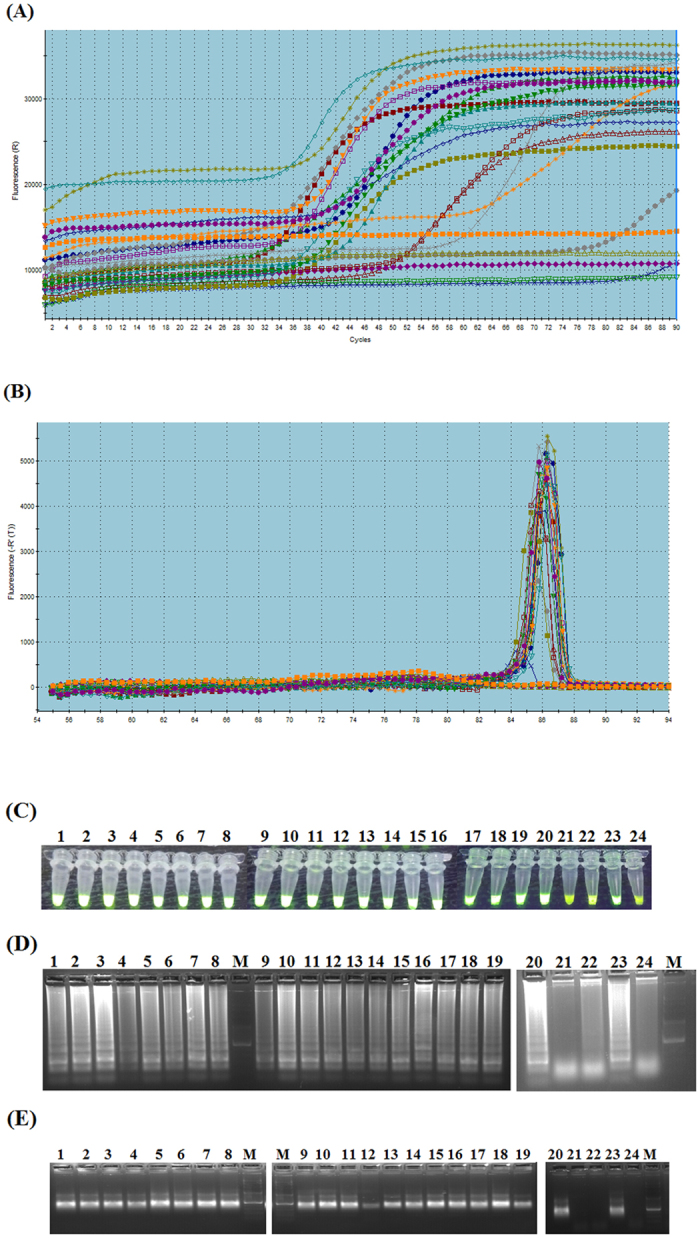
Figure 5. Evaluation of PCLSR.

Panel (A) fluorescent curves observed after PCLSR in MX3005 P real-time PCR system (Stratagene). The presence of relative fluorescence increase (‘R’-T) during the following minutes of the reaction was considered as positive result. The curves were observed starting from 32 min. (21st case) up to 78 min. (64th case). Panel (B) melting curve analysis of PCLSR products positive for ASFV’ DNA. The common temperature point for all positive samples is 85.3 °C. Panel (C) PCLSR – assessment of ASFV positive samples after addition of 1 μl of a 1:10 stock dilution of 10,000 x DMSO concentrated SYBR Green I dye (Invitrogen) to the reaction tubes and UV light illumination. Panel (D) gel electrophoresis of (1.5% agarose gel, stained with a SimplySafe solution) (EURx, Gdansk, Poland) of PCLSR products. Visible “ladder-like” pattern in ASFV positive samples. Panel (E) PCR for PCLSR results verification. The PCR was conducted with application of outer-spiral primers. Field samples from 17 ASF cases in wild boar and 3 outbreaks in pigs (lanes 1–20), 21 – blood collected from a non-infected pig, 22 – cDNA extracted from a classical swine fever virus (CSFV) strain Alfort/187, 23 – positive control standard ASFV plasmid containing a p72 gene fragment (7.2 × 10⁷ copies μl−1); 24 – cDNA extracted from a porcine reproductive and respiratory syndrome virus (PRRS) strain Lelystad (genotype I). M – molecular length marker GeneRule 100 bp DNA Ladder Plus (Thermo-scientific, Waltham, Massachusetts, USA).
