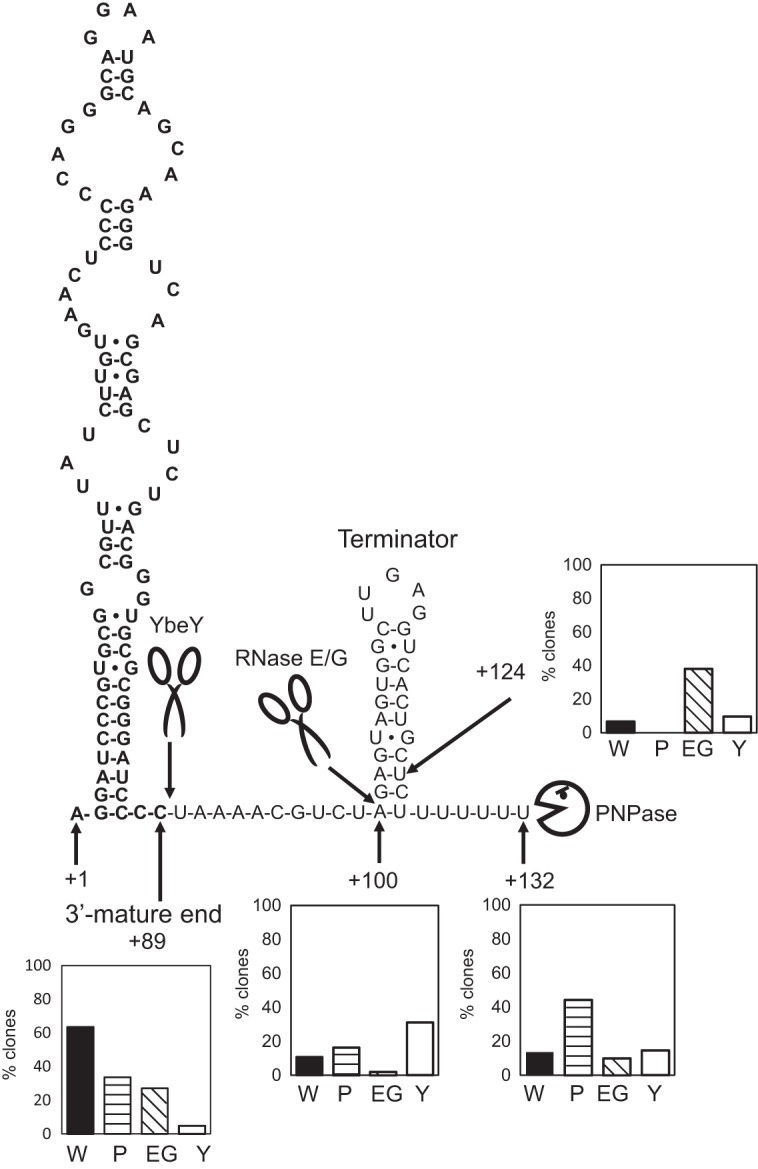
FIG 4.

Model for the 3′ maturation of 4.5S RNA in C. glutamicum. The predicted secondary structure of the 4.5S RNA is shown. Bold letters indicate the mature 4.5S RNA sequence. Scissor symbols represent RNase E/G and YbeY. A Pac-Man symbol represents PNPase. Cleavage sites are indicated by arrows. RNA fold software (mfold [http://mfold.rna.albany.edu/?q=mfold/rna-folding-form]) was used to predict the secondary structure of the 4.5S RNA. The positions of the TSS (position +1) and the 3′ ends of 4.5S RNA precursors, determined by 3′ RACE analysis, are shown. The histograms represent the percentage of each sequenced clone of the different mutants listed in Table 1 having the main 3′ ends (the +89, +100, +124, and +132 ends), as determined by 3′ RACE analysis. The TSS of the 4.5S RNA is defined as position +1. W, wild type; P, Δpnp mutant; EG, ΔrneG mutant; Y, ΔybeY mutant. For details, see the text.
