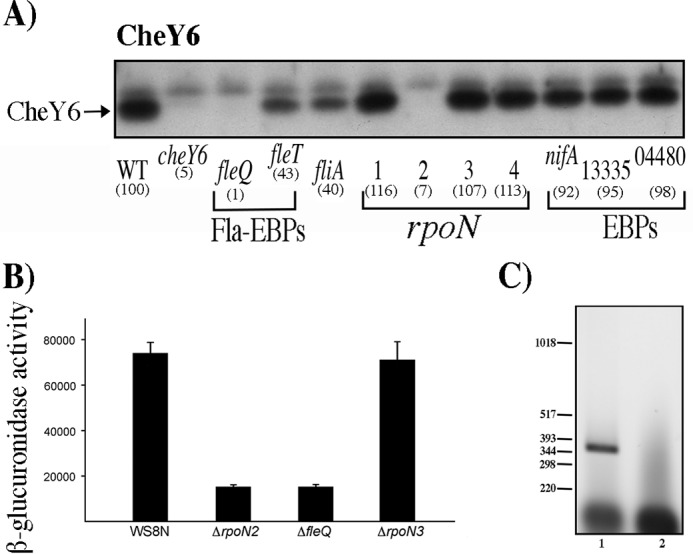
FIG 4.

Determination of the presence of CheY6 in different strains, activity of the reporter gene uidA fused to the regulatory region of cheOp3 in the pBBMCS53 plasmid, and RT-PCR of cheY6 and its upstream gene. Total cell extracts obtained from cell cultures grown in Sistrom's minimal medium and harvested at an OD600 of 0.6 were tested as described in Materials and Methods. (A) Total cell extracts were separated by gel electrophoresis, transferred to nitrocellulose, and probed with anti-CheY6 antibodies (1:3,000). WT, WS8N cell extract. Each lane is labeled according to the relevant mutation present in the strain. Square brackets group the samples according to their function. Fla-EBPs indicate the two enhancer binding proteins required for activation of the fla1 genes, rpoN indicates the genes encoding σ54-1, -2, -3, or -4, and EBPs indicate the genes encoding proteins that belong to the enhancer binding protein family in the R. sphaeroides genome sequence. The signal identified as CheY was quantified by densitometry using ImageJ; the resulting value was normalized using an unspecific band on the blot. The values shown in parentheses are the average results of three independent experiments and are expressed as a percentage of the WT level. Figure S3 shows the graph of these values with SD. (B) β-Glucuronidase activity of the wild-type and mutant strains carrying the plasmid pBBMCS53_cheA4. Activity is reported in picomoles of 4-methylumbelliferone produced per minute per milligram of protein. The mean values and standard deviations of the results of three independent determinations are shown. (C) Agarose gel of the RT-PCR products of the primer pair that amplifies the region encompassing cheY6 and its upstream gene tlpT. A 391-bp product was expected for these primers. Lane 1, 5 μl from the RT-PCR; lane 2, 5 μl from the control reaction carried out in the absence of reverse transcriptase. The relevant sizes in base pairs of the DNA molecular size marker X (Roche Life Science) are shown on the left.
