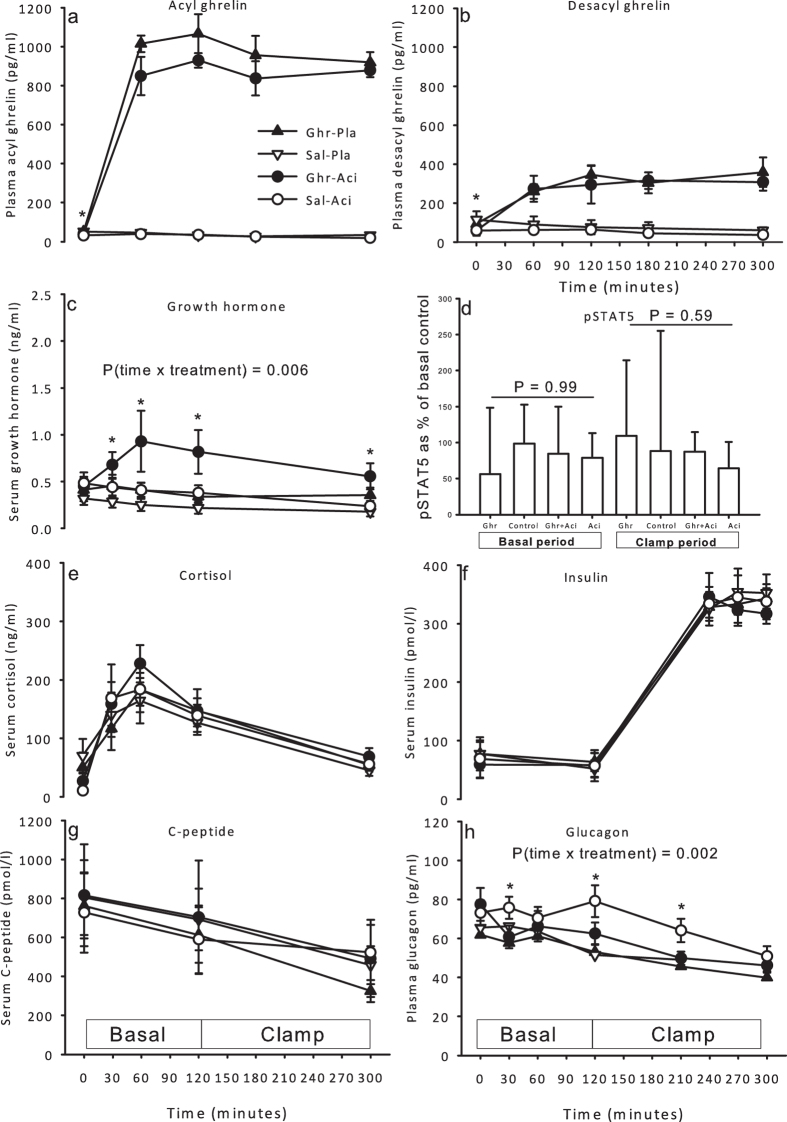
Figure 1. Hormones and phosphorylated STAT5 during ghrelin, saline, ghrelin and acipimox, and acipimox.
(a) Plasma levels of acyl ghrelin increased in response to ghrelin infusion. (b) Plasma levels of desacyl ghrelin at baseline were lower during acipimox treatment. Desacyl ghrelin concentrations increased in response to ghrelin infusion. (c) Serum levels of GH increased in response to ghrelin and acipimox treatment. (d) Relative levels of pSTAT5 content in skeletal muscle tissue in the basal and in the clamp period. pSTAT5 was similar during all conditions. (e) Serum levels of cortisol. (f) Serum levels of insulin. (g) Serum levels of C-peptide. (h) Plasma levels of glucagon increased initially during acipimox treatment and were normalized at the end of the clamp period. Printed P values refer to one-way ANOVA analyses or two-way analyses as indicated. *P < 0.05 at a given time point. All data are presented as mean ± SE.

