
Figure 4. Glucose metabolism during ghrelin, saline, ghrelin and acipimox, and acipimox-alone in the basal and in the clamp periods.
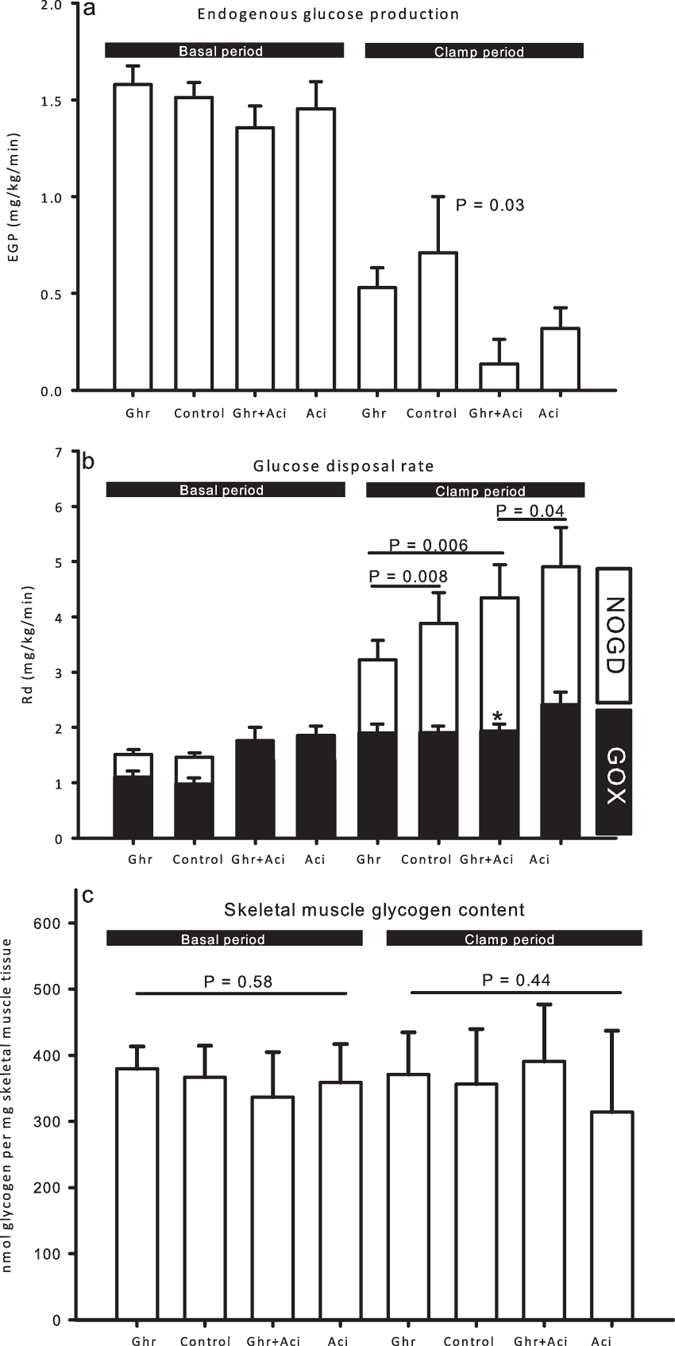
(a) EGP was equal in the basal period during all four conditions. During the clamp EGP was suppressed by acipimox. Printed P value refers to two-way ANOVA treatment effect of acipimox. (b) Glucose utilization during the terminal 30 min of basal and clamp periods. Glucose metabolism was similar in the basal period. During the clamp, ghrelin reduced glucose disposal both with and without acipimox treatment. Acipimox reversed the suppressive effect of ghrelin on glucose disposal during the clamp. Printed P values refer to paired t tests. (c) Skeletal muscle glycogen content. Printed P values refer to one-way ANOVA tests. All data are presented as mean ± SE.