
Figure 5. Phosphorylated enzymes in the insulin signaling cascade and lipid oxidation.
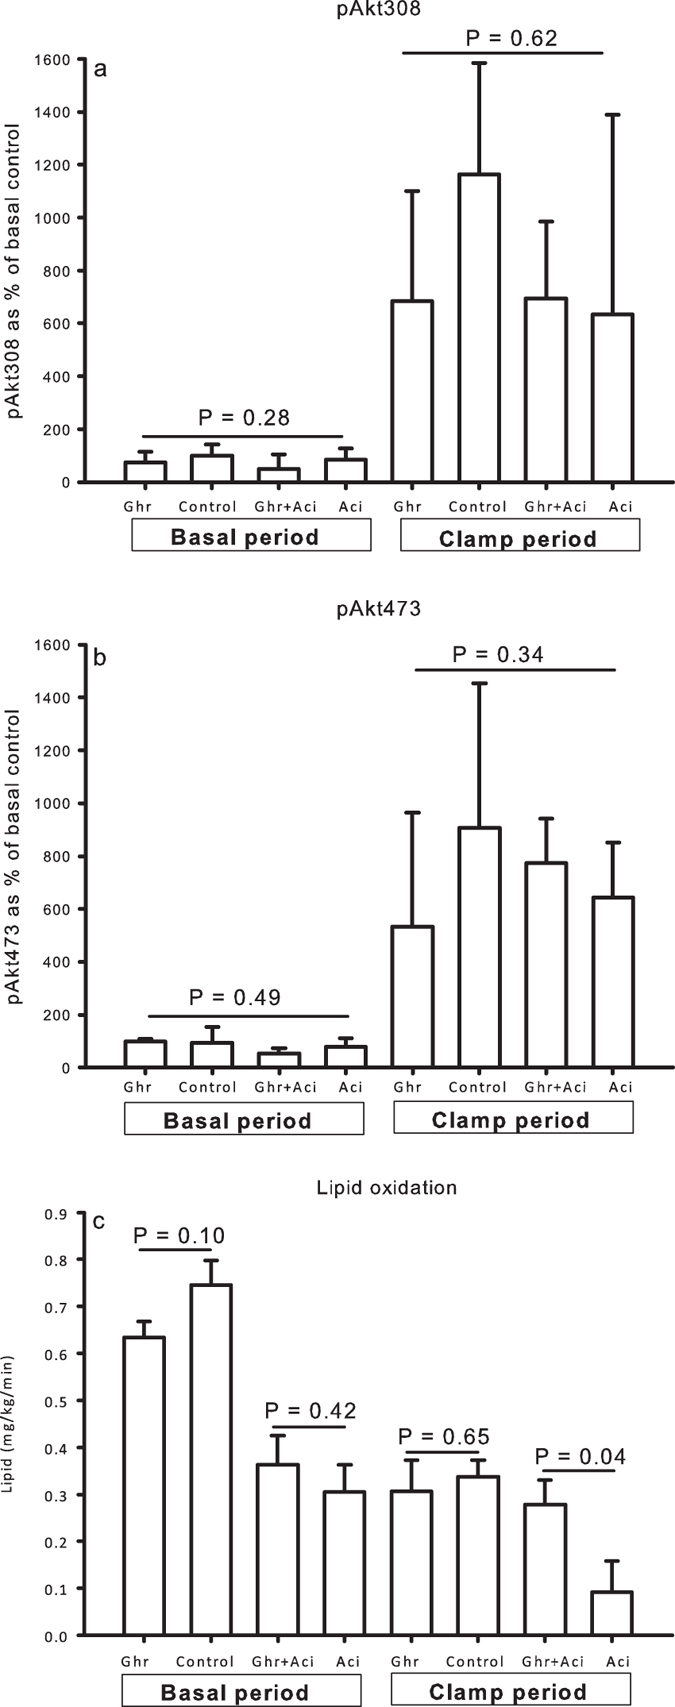
(a and b) Ghrelin did not impact on relative levels of pAkt308 and -473 content in skeletal muscle tissue in the basal and in the clamp period. (c) Ghrelin antagonized the suppressive effect of acipimox on lipid oxidation during the clamp. Printed P values refer to one-way ANOVA tests (a and b) or paired t tests (C). All data are presented as mean ± SE.