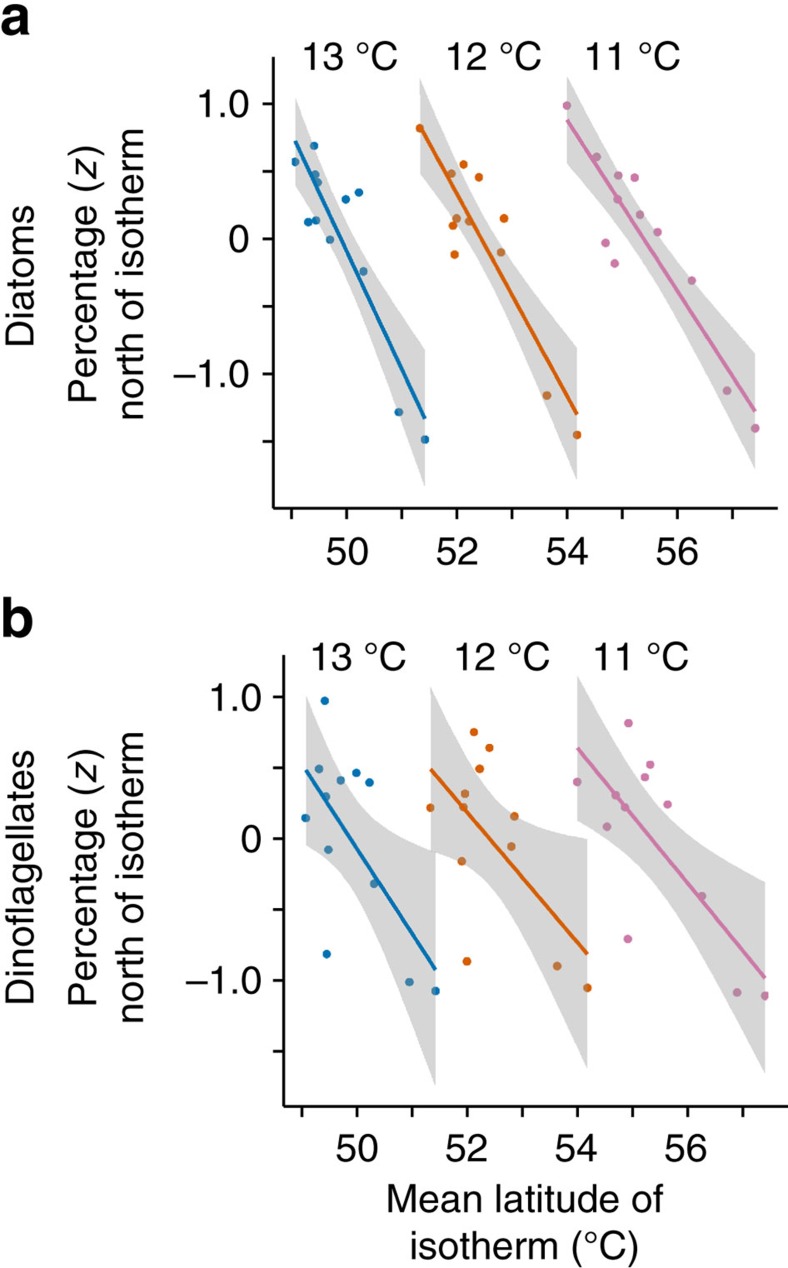
Figure 2. Proportions of diatom and dinoflagellate populations north of three isotherms.
Proportions (normalized) of the (a) diatom and (b) dinoflagellate populations north of the three isotherms within the geographic area 45–64° N, 20° W–8° E in the twelve 5-year periods from 1954–1958 to 2009–2013. The isotherms move north as the SST rises; these plots illustrate negative correlations (at P<0.05) between the normalized population percentages north of each isotherm and the mean latitude of the isotherms. A loess smoother was used for locally weighted polynomial regression, the grey area indicating the 95% confidence interval for the line. The P values are listed in Supplementary Table 1a.

