FIG 2.

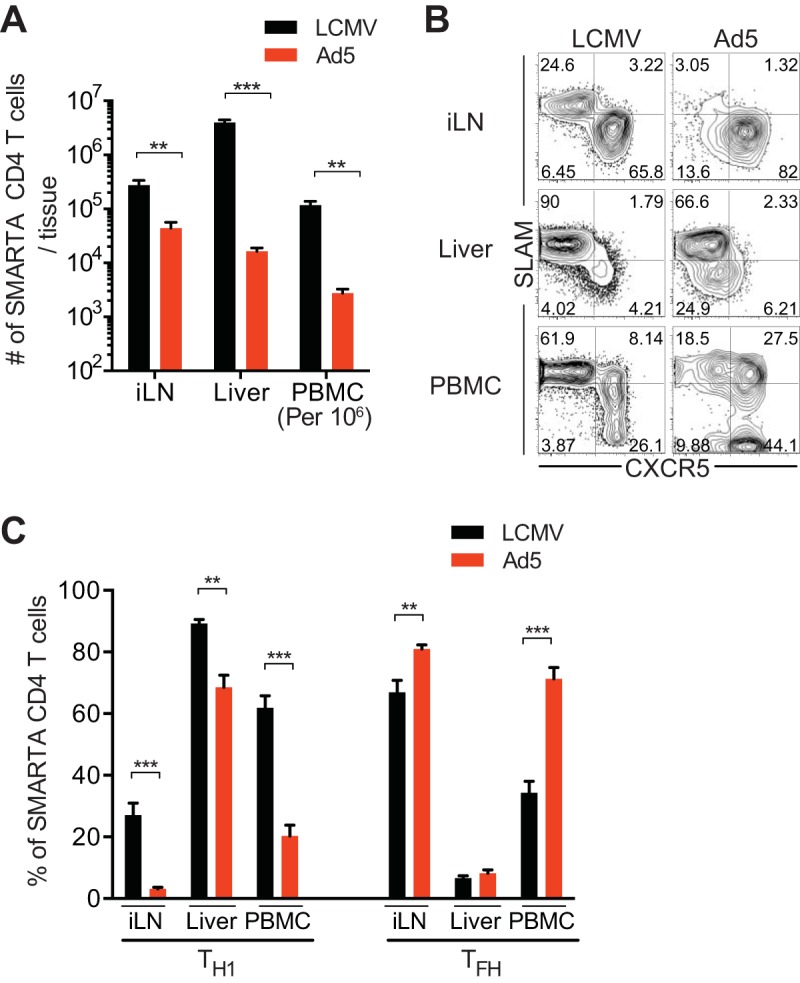
Suboptimal Th1 responses are found in tissues, including lymphoid and nonlymphoid organs, after Ad5 immunization. Data are from the same experimental setup as in Fig. 1. SMARTA CD4 T cells were analyzed in inguinal lymph nodes (iLN), liver, and peripheral blood mononuclear cells (PBMC) 8 days after Ad5 immunization or LCMV infection. (A) Numbers of SMARTA CD4 T cells in the indicated tissues. Numbers of SMARTA CD4 T cells in blood were calculated per 1 million PBMC. (B) Representative FACS plots showing the phenotype of SMARTA CD4 T cells. (C) Percentages of SLAM+ CXCR5− Th1 or CXCR5+ Tfh SMARTA CD4 T cells in the indicated tissues. Data are representative of 2 independent experiments with 4 to 5 mice per group per experiment. Error bars indicate standard errors of the means. **, P < 0.01; ***, P < 0.001.
