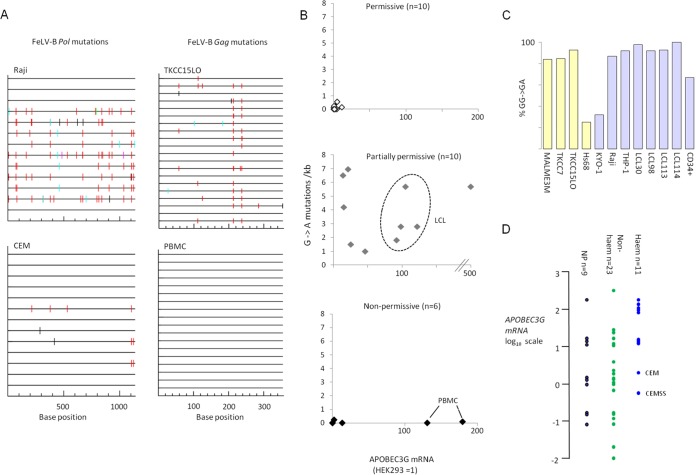
FIG 5.
Hypermutation of the FeLV-B genome and APOBEC3G mRNA expression in human cells. FeLV genomic sequences (segments of Gag and Pol) were cloned by PCR from infected human cells, and individual templates were sequenced and compared to the reference input virus (pFGB clone). APOBEC3G mRNA expression was determined in the same cells (prior to infection) by quantitative real-time PCR (with SYBR green). (A) Representative plots of hypermutation visualized by the online HYPERMUT program (www.hiv.lanl.gov/content/sequence/HYPERMUT/hypermut.html), where sequence changes relative to the reference FeLV-B genome are color coded (red, GG→AG; cyan, GA→AA; green, GC→AC; magenta, GT→AT; black, non-G→A). (B) X/Y plots of G→A mutation (per kilobase) against APOBEC3G mRNA levels (where the level in HEK293 cells is taken as 1) with cell lines sorted according to FeLV restriction phenotype. Results for LCLs, which are discordant by virtue of their low levels of infectious virion release (Table 2) but postinfection accumulation of proviral DNA (Fig. 3), are enclosed by a dashed oval. (C) Percentage of G→A mutations that conform to the A3G signature (42) for all cell lines in which significant levels of mutations were detected. Blue-gray bars, hematopoietic cells; yellow bars, nonhematopoietic cells. (D) Relative levels of APOBEC3G mRNA (on a log10 scale, with the level in HEK293 cells taken as 1) for all the cell lines tested, sorted into hematopoietic (blue circles) and nonhematopoietic (green circles) cell lines. Nonpermissive cells (nonspreading, with low virion release) are represented by black circles.

