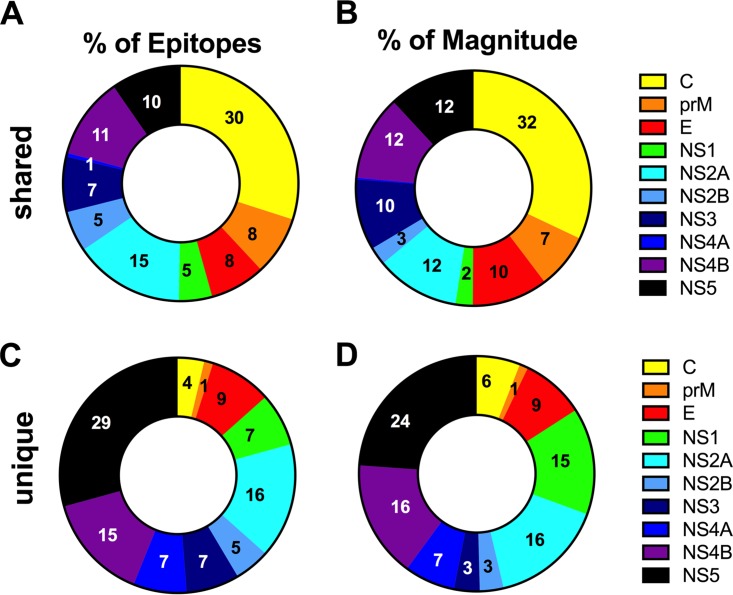
FIG 4.
Antigen distribution of epitopes induced by TV005. The relative numbers and magnitudes of responses induced by TV005 and also recognized in natural infection (shared) (A and B) versus uniquely recognized in TV005 recipients (C and D) are shown. Panels A and C relate to the percentages of epitopes recognized, while panels B and D relate to the relative proportions of the total magnitude of responses for each protein. Yellow, capsid; orange, membrane precursor (prM); red, envelope (E); green, NS1; turquoise, NS2A; blue, NS2B; dark blue, NS3; purple, NS4A; pink, NS4B; black, NS5. The pie charts in panels A and C were obtained by counting the total number of epitopes detected in the study and subdividing them as a function of whether or not they were also detected in natural infection studies (17). Similarly, the pie charts in panels B and D were obtained by summing the total response for all detected epitopes derived from each protein and dividing it by the total response for all epitopes detected in the study.

