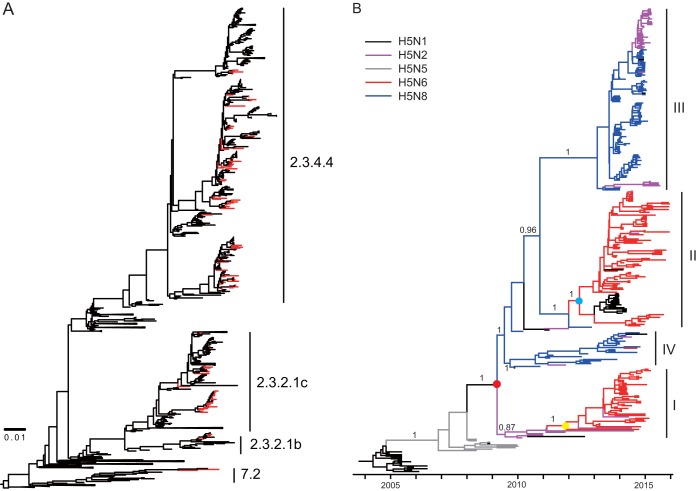
FIG 2.
Evolutionary analysis of H5 gene sequences. (A) Maximum likelihood phylogenetic analysis of HA genes of 108 HPAI H5 viruses. The viruses isolated in our study are highlighted in red. (B) Bayesian maximum clade credibility (MCC) phylogeny of clade 2.3.4.4 HPAI H5Nx viruses. The phylogenetic clades that included clade 2.3.4.4 HPAI H5N2/N6/N8 viruses were obtained from the dated phylogeny of HA gene segments constructed by molecular phylogenetic analysis and are further aligned onto the same time scale. The branches in purple, blue, red, gray, and black represent clade 2.3.4.4 HPAI H5N2, H5N8, H5N6, H5N5, and H5N1 viruses, respectively. The tMRCAs of the clade HPAI H5Nx viruses and the two H5N6 subgroups are indicated by red, blue, and yellow dots. The posterior probabilities of the main branches are shown as numbers. For details of the phylogeny, see Fig. S1 in the supplemental material.

