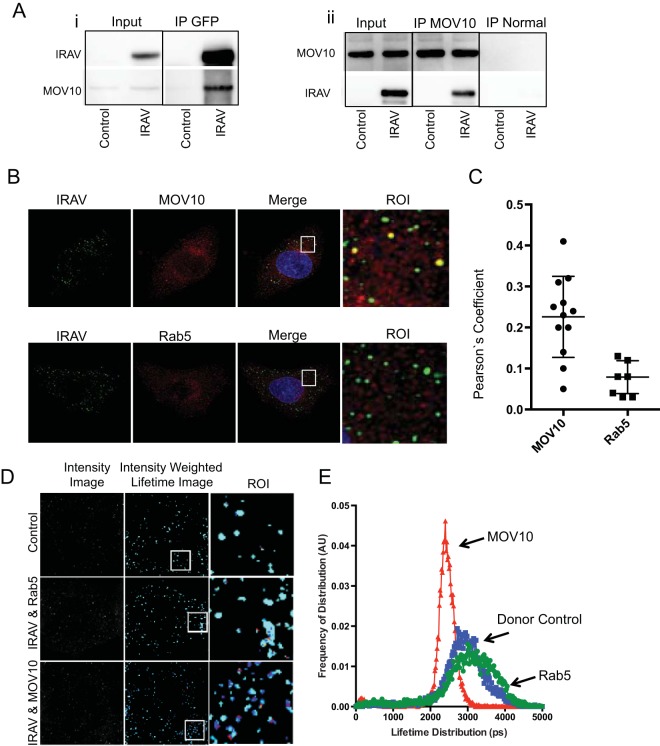
FIG 7.
IRAV interacts with MOV10. (A) Co-IP experiments performed on HEK293 cells transfected with expression vectors for GFP-IRAV (IRAV) or GFP-CAT (Control), followed by IP with either an antibody for GFP (i) or endogenous MOV10 (ii). Normal IgG was used as a negative control for endogenous MOV10. Western blots were then performed for IRAV or MOV10. (B) Confocal microscopy of IRAV and MOV10 or Rab5 in IFN-β-treated A549 cells. Green, IRAV; red, MOV10 or Rab5. The nucleus was stained with DAPI (blue). ROI are boxed in white. (C) Colocalization coefficients of IRAV and MOV10 or Rab5 in IFN-β-treated A549 cells as determined by Pearson's linear correlation coefficient. (D) Representative image of FRET-by-FLIM analysis of IRAV interactions with MOV10 or Rab5 in IFN-β-treated A549 cells, showing the image intensity, intensity-weighted lifetime, and selected ROI. (E) Lifetime distribution plot versus frequency of distribution, in arbitrary units (AU), of FRET-by-FLIM analysis of IRAV (donor control), IRAV and MOV10, or IRAV and Rab5 in IFN-β-treated A549 cells. The plot was constructed using data from 10 images each, collected from two independent experiments. IRAV interactions with MOV10 are shown in red, Rab5 in green, and the donor control in blue. The error bars represent standard deviations.

