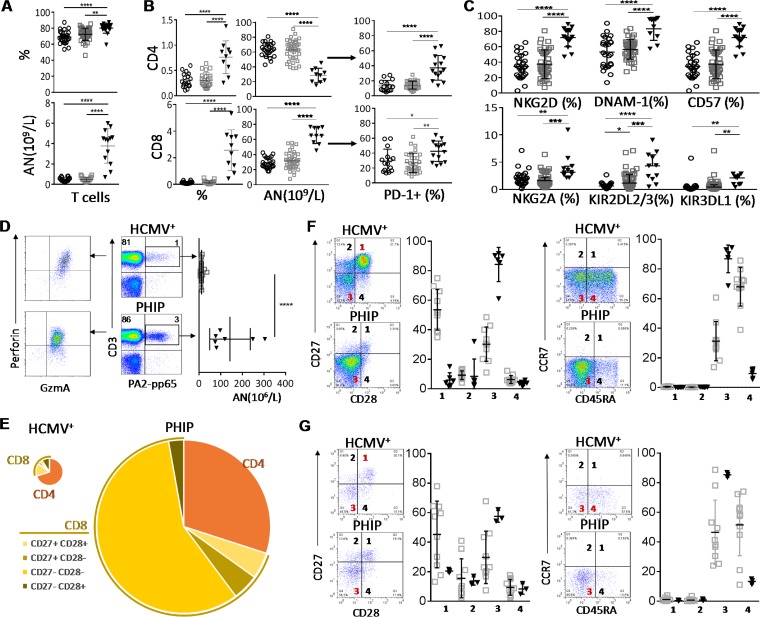
FIG 2.
Early differentiation of CD3+ CD56− T cells in PHIP. (A) Frequency (n = 26 HCMV−; n = 39 HCMV+; n = 17 PHIP) and absolute number (n = 18 HCMV−; n = 23 HCMV+; n = 13 PHIP) of CD3+ CD56− T lymphocytes. (B) Absolute numbers (n = 18 HCMV−; n = 23 HCMV+; n = 10 PHIP) and frequencies (n = 24/25 HCMV−; n = 39 HCMV+; n = 10 PHIP) of CD4+ and CD8+ T cells. Frequencies of PD-1+ among CD4+ and CD8+ T cells (n = 15 HCMV−; n = 32 HCMV+; n = 14 PHIP). (C) AN and frequencies of NKG2D+, DNAM-1+, CD57+, NKG2A+, KIR2DL2/3+, and KIR3DL1+ T cells. Frequency results are shown as means ± SEM. (D) Density plots illustrating HLA-A2/pp65 pentamer-stained CD3+ T lymphocytes from representative HCMV+ individuals and PHIP and representative patterns of granzyme A and perforin expression in HLA-A2/pp65-specific cells. The scatter plots represent the absolute number of HLA-A2-pp65-specific CD3+ T cells from HCMV+ healthy individuals (n = 13) and PHIP (n = 6). (E) Patterns of CD4 and CD8 cell composition following CD27 and CD28 expression for CD8+ T cells in HCMV+ individuals and PHIP. We summed all cell subsets, weighting them according to their frequencies, as indicated. The size of the pie chart is proportional to the absolute number of total T lymphocytes. (F and G) Density plots illustrating the pattern of CD27/CD28 and CD45RA/CCR7 expression and corresponding scatter plots of frequencies observed in CD8+ T cells (F) and HLA-A2–pp65-specific T cells (G) from HCMV+ individuals (n = 10) and PHIP (n = 6). Means and SEM are shown. Statistical significance (*, P < 0.05; **, P < 0.01; ***, P < 0.001; ****, P < 0.0001) between more than two groups was determined using one-way ANOVA and between two groups using an unpaired t test.

