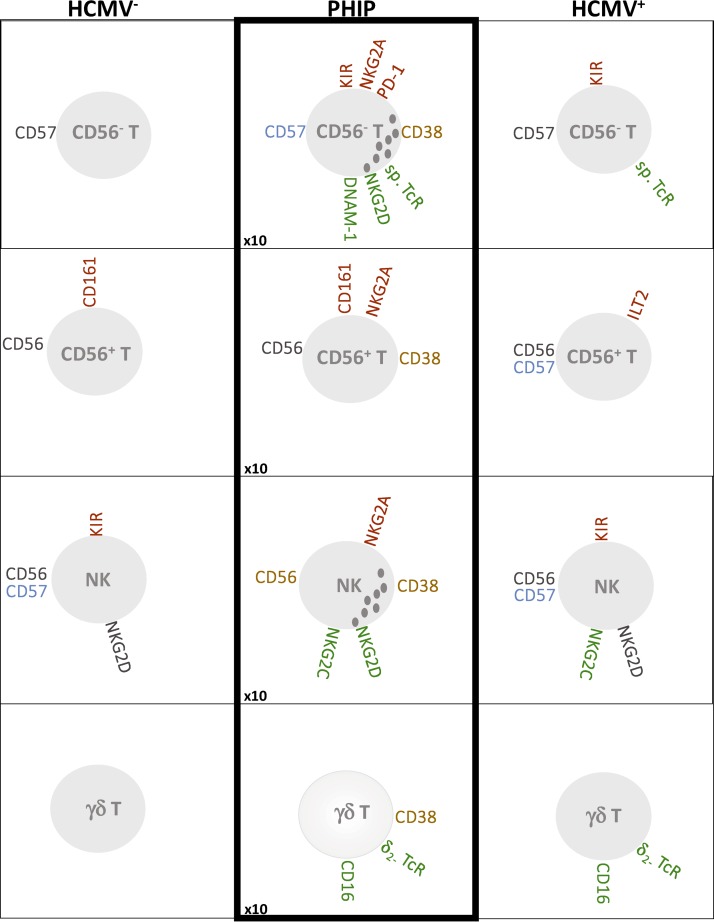
FIG 7.
Schematic representation of main phenotypic modulations on T cell (CD56−, CD56+, and γδ) and NK cell compartments. Inhibitory receptors are indicated in red, activating receptors in green, receptors with increased MFI in blue, and markers associated with activated status in orange. The increased ratio of absolute lymphocyte counts in PHIP is indicated at the bottom left.

