Fig. 3.

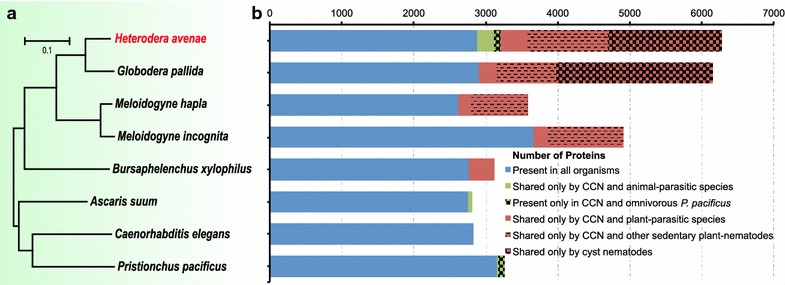
Phylogeny and ortholog distribution of 8 nematodes with diverse life styles. a A genome-based phylogentic tree generated by 703 single ortholog families. Scale (0.1) represents the number of amino acid changes per site. b Distribution of orthologous identified in H. avenae and other 7 selected nematodes with published genomic data
