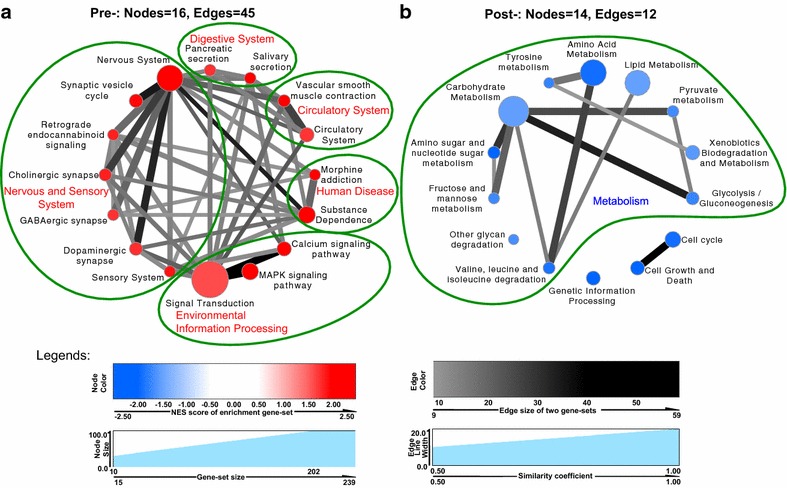
Fig. 5.

Crosstalks of significantly enriched KEGG pathways before and after parasitism in H. avenae. Crosstalks of significantly enriched KEGG pathways from H. avenae at pre-parasitic (a, red nodes) and post-parasitic (b, blue nodes) stages. Node, a KEGG pathway gene-set, and the node sizes positively correlate with the number of genes in the pathway; the darker the color is, the more significantly the gene-sets are enriched (P < 0.01, FDR < 0.25). Edge, the relevance of two gene-sets, and the more relevant (similarity >0.5), the more genes shared by two gene-sets; the darkness and thickness of lines positively correlate with amount of genes and similarity of two gene-sets, respectively. The normalized enrichment score (NES) is the primary statistic for evaluating gene set enrichment by GSEA
