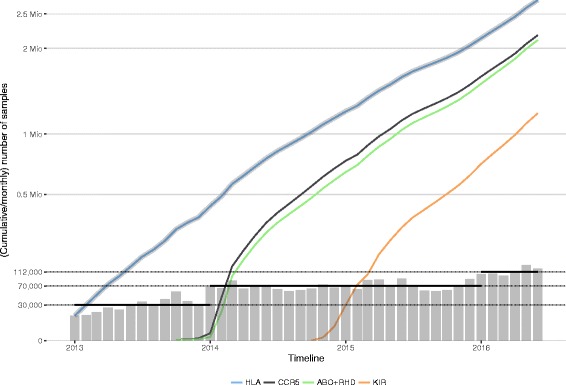
Fig. 1.

Cumulative and monthly numbers of donor samples genotyped at the DKMS Life Science Lab since 2013 as part of routine operations. The grey line shows the total cumulative number of genotyped samples, the coloured lines show gene-specific cumulative numbers; grey-shaded bars indicate monthly throughput. Black horizontal bars show (bi-)yearly mean throughput. The y-axis is square root scaled to enhance readability
