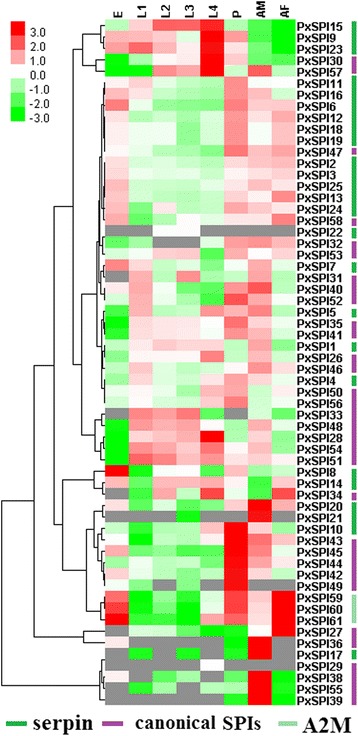
Fig. 5.

Expression profiling of PxSPIs at different developmental stages. The log2 RPKM values are colored, where red represents higher expression, green represents lower expression, and gray represents the RPKM values missed. E, eggs; L1-L4, 1st, 2nd, 3rd and 4th-instar larvae; P, pupae; AM, adult males; AF, adult females
