
Fig. 3.
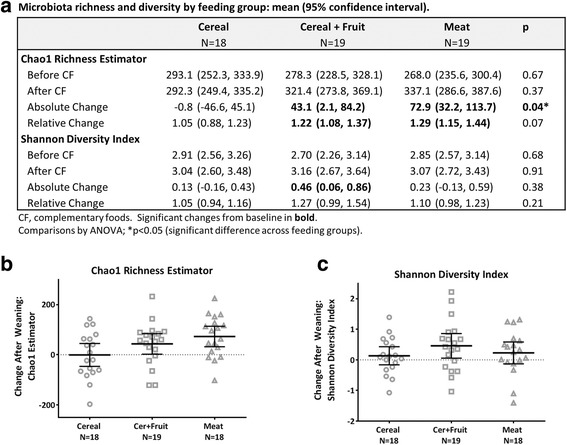
Change in microbiota richness and diversity after introduction of complementary foods. a Microbiota richness and diversity by feeding group. b Chao1 richness estimator. c Shannon diversity index. Bars indicate means with 95% confidence intervals. Between-group comparison by ANOVA. *Significant change from baseline (p < 0.05)