Fig. 5.

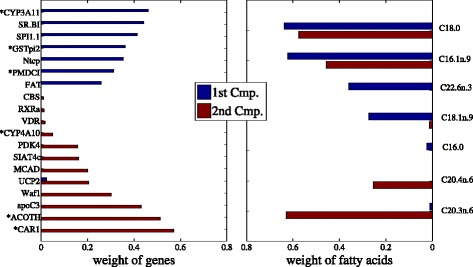
Feature selection of sparse CCA in nutrigenomic data. Left and right panels show selected genes and fatty acids, respectively. Genes marked with asterisks show significantly different expression in different genotypes

Feature selection of sparse CCA in nutrigenomic data. Left and right panels show selected genes and fatty acids, respectively. Genes marked with asterisks show significantly different expression in different genotypes