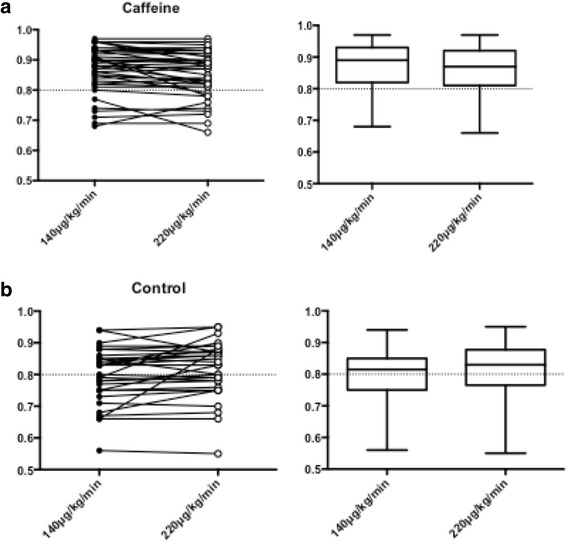
Fig. 7.

a In a paired comparision of caffeine consumption, FFR was significantly higher in the group receiving standard dose versus high dose (0.89 [0.83–0.93 vs 0.87 [0.81–0.91], p = <0.001). b In the control group, this difference was reversed to significantly lower FFR in standard dose compared to high dose (0.82 [0.75–0.85] vs 0.83 [0.77–0.89], p = 0.02)
