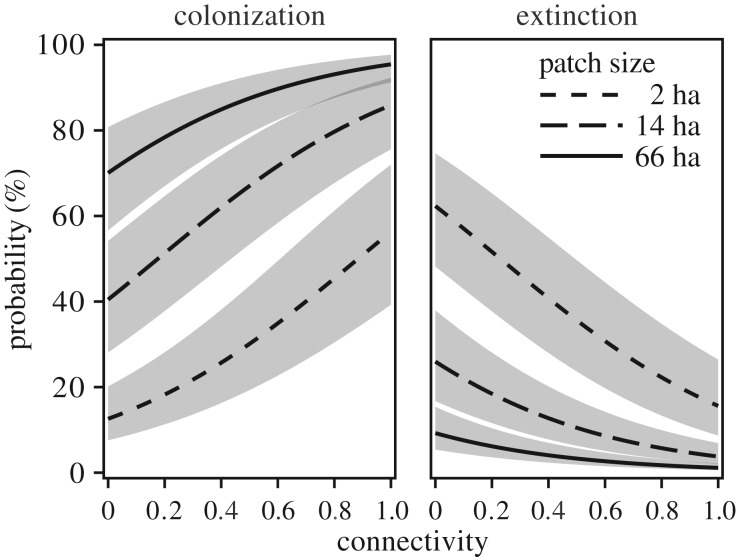
Figure 3.
Predicted probabilities of patch colonization and extinction as a function of patch size (line type) and demographic connectivity based on the best model (no. 6; time-varying fecundity and dispersal; see table 1 and Methods). Lines and shaded areas represent marginal model predictions and 95% confidence intervals, respectively. Patch sizes represent median values between 33% quantiles of patch area.

