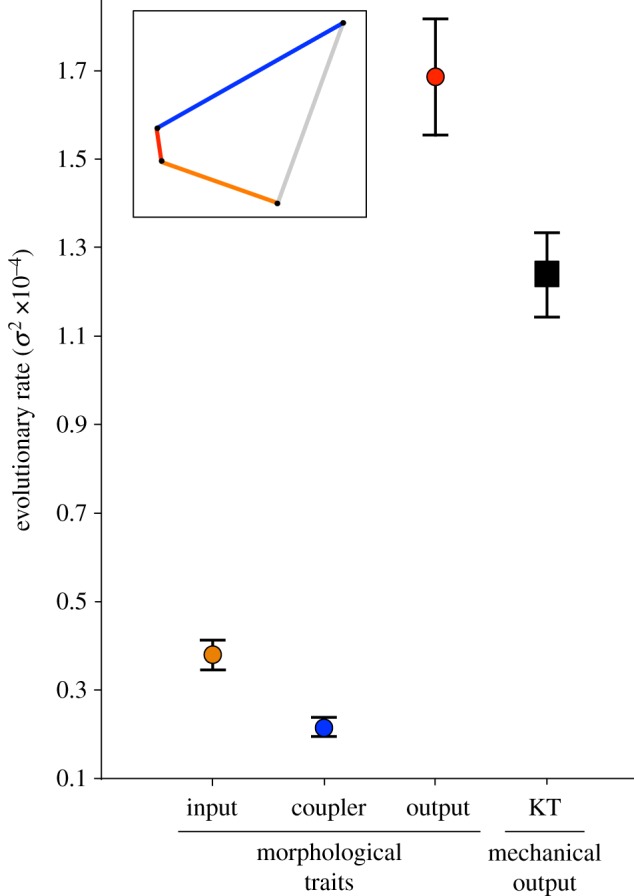
Figure 3.

The evolutionary rates (σ2) for the output link and kinematic transmission (KT) are higher than the rates for the input and coupler links. Each rate is given with its 95% CI. Inset shows the configuration of the input (orange), output (red), and coupler (blue) links in the four-bar linkage system, and KT is denoted in the main panel in a black square. (Online version in colour.)
