
Fig. 2.
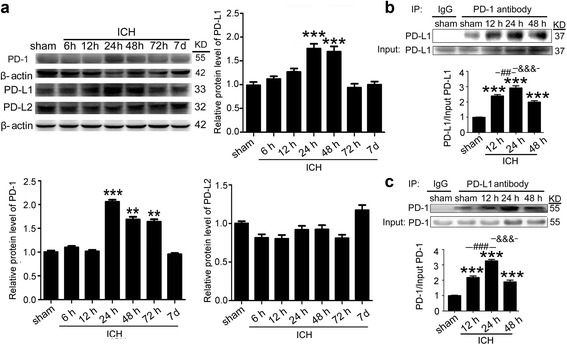
ICH increased the protein levels of PD-1/PD-Ls and the interaction between PD-1 and PD-L1. a Time course of the protein levels of PD-1, PD-L1, and PD-L2 in the brain tissue around hematoma after ICH. Representative western blot bands of PD-1, PD-L1, and PD-L2 and quantitative analysis of the relative protein level were shown. The mean value of sham group was normalized to 1.0. Data are expressed as mean ± SEM, n = 6. Double asterisks indicate p < 0.01, triple asterisks indicate p < 0.001 vs. sham group. b, c Immunoprecipitation analysis of the interaction between PD-1 and PD-L1 at indicated times after ICH. All values are means ± SEM, n = 6. triple asterisks indicate p < 0.001 vs. sham group, triple pound signs indicate p < 0.001