Figure 5.
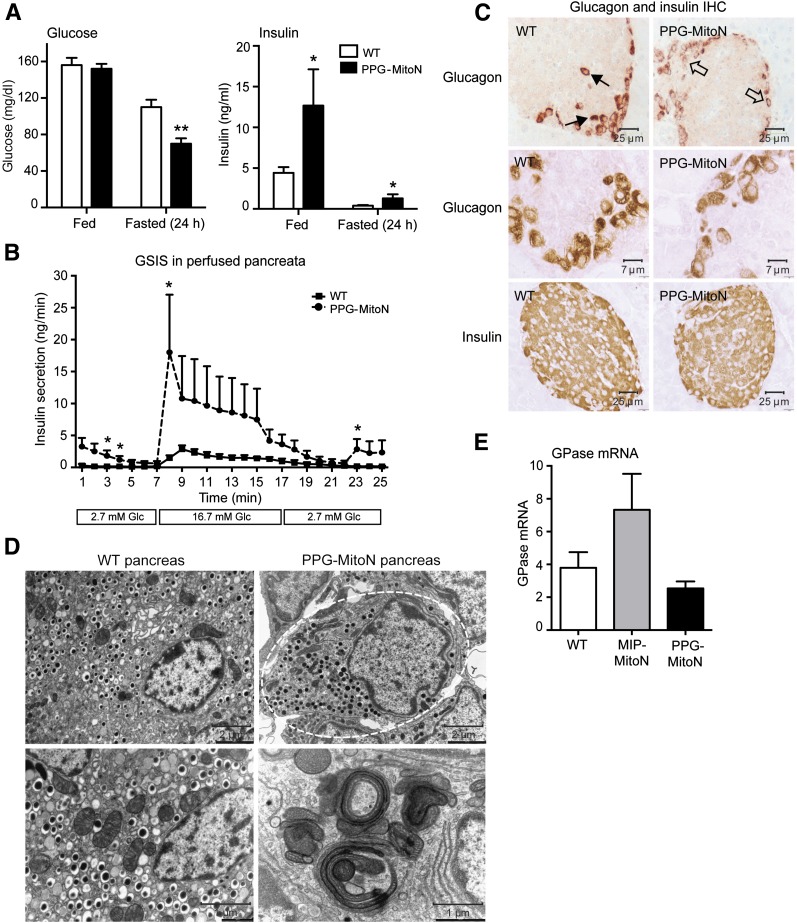
Enrichment of mitoNEET in α-cells results in fasting-induced hypoglycemia, hypersecretion of insulin during GSIS, and low glucagon–positive signal in islets. A: Ad libitum and fasted (24 h) glucose and insulin levels in male C57/BL6 WT vs. PPG-MitoN mice after 2 weeks of Dox-HFD (600 mg/kg) feeding (n = 4). Data are mean ± SEM. *P < 0.05, **P < 0.01. B: Insulin secretion rates (ng/min) during perfusion of pancreata of Dox-HFD (600 mg/kg)–fed WT and PPG-MitoN mice. Pancreata were perfused with a low glucose dose (2.7 mmol/L glucose) for up to 7 min followed by a high glucose dose (16.7 mmol/L glucose) for up to 10 min and then again with a low glucose dose for up to 8 min (n = 3). *P < 0.05. C: IHC staining of glucagon (top and middle panels, with the middle panel showing a higher resolution image) in addition to insulin IHC (bottom panel) in pancreata derived from WT vs. PPG-MitoN mice fed Dox-HFD (600 mg/kg) for 3 weeks. Solid arrows point to normal glucagon expression in α-cells in WT pancreata, whereas open arrows indicate loss of glucagon-positive staining in PPG-MitoN α-cells. D: Representative EM images of WT and PPG-MitoN pancreata from mice fed Dox-HFD (600 mg/kg) for 3 weeks. The dashed outline highlights glucagon granules within one α-cell. Scale bars indicate the resolution at which each image was taken. E: Hepatic glucose-6-phosphatase (GPase) gene expression levels after a 24-h fast in WT, MIP-MitoN, and PPG-MitoN mice after 3 weeks of Dox-HFD (600 mg/kg) feeding (n = 4). Glc, glucose.

