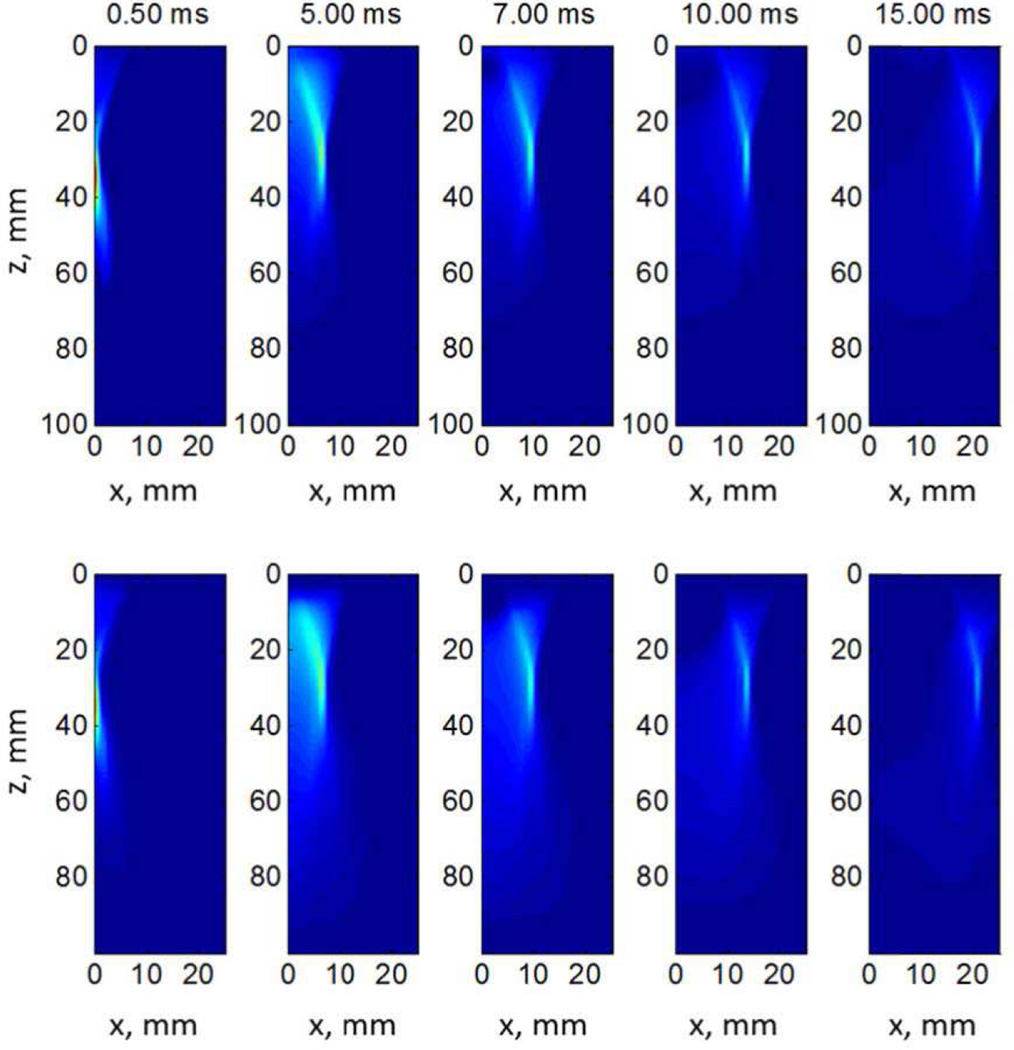
Fig. 9.
Shear wave propagation of LS-DYNA (top row) and Abaqus (bottom row) at different time points in a quarter-symmetry mesh of an elastic µ = 2 kPa material. The color scale represents normalized displacement across each respective dataset. The isocontours of color in the 0.50 ms frames closely represent the half-plane of the acoustic radiation force excitation distribution use for the 30 mm focus in the digital phantoms accessible on the QIDW (Appendix A). Notice that the apparent skew in the shear wave displacement profile with propagation through time is expected as the recovery time from such an excitation is considerably slower than the initial time to achieve peak displacement (Figure 3, right middle row plot).

