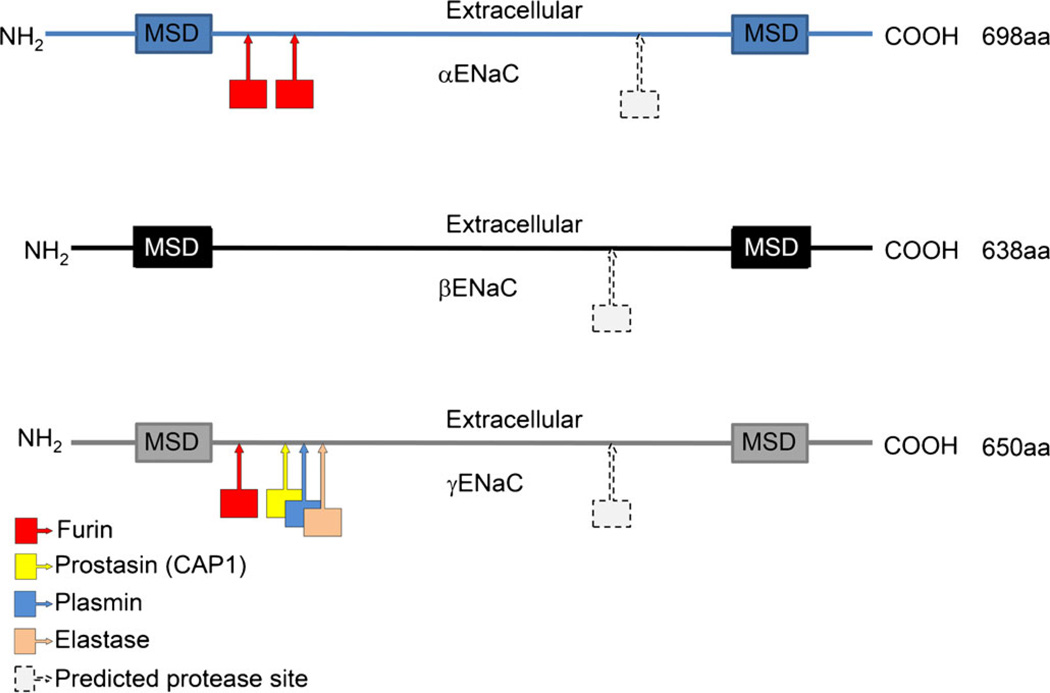
Fig. 1.
Representation of α-, β- and γ-ENaC structures with the approximate locations of confirmed and predicted protease cleavage sites (aa amino acids, MSD membrane spanning domain). Based on figures presented in Kleyman et al. (2009), Rossier and Stutts (2009) and Hamm et al. (2010)

