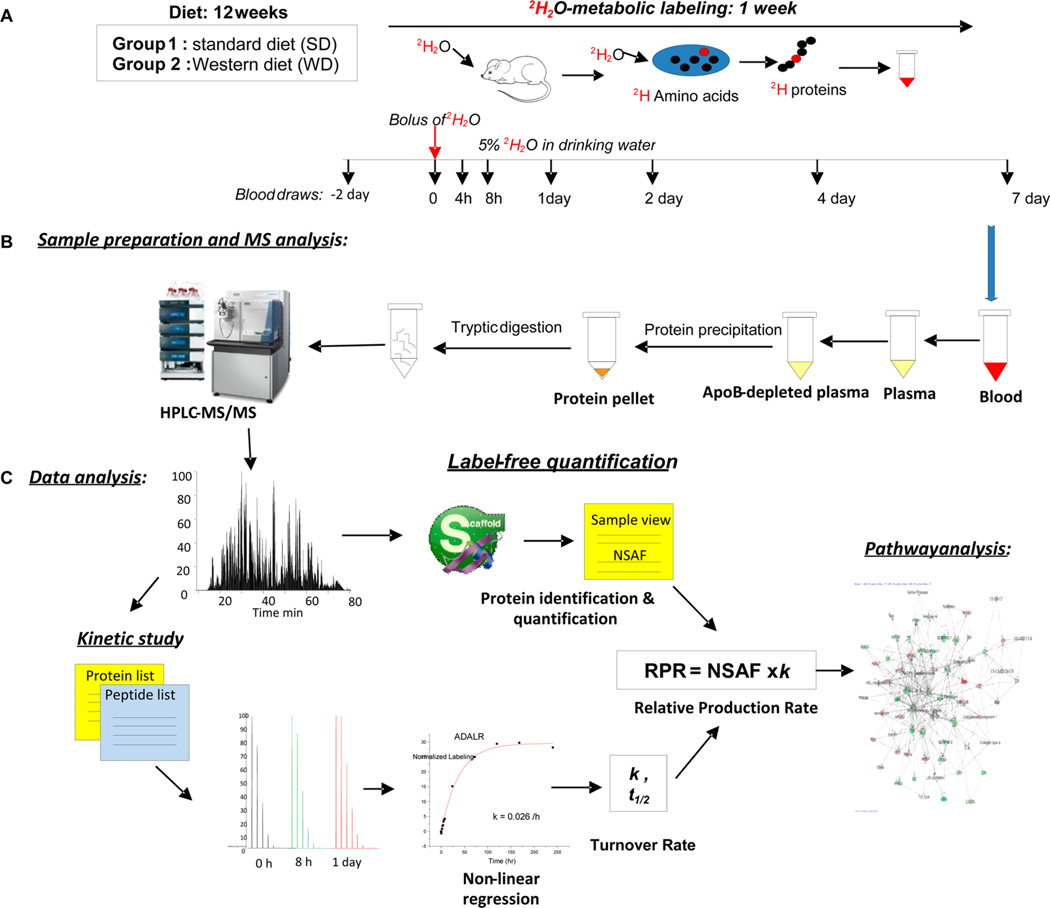
Figure 1.
Experimental design and workflow for the proteome dynamics study. (A) At the beginning of the 12th week of the diet experiment, mice were given a bolus injection of pure 2H2O followed by the administration of 5% 2H2O in drinking water. Small blood samples were taken at different time points up to 1 week. (B) Proteins from apoB-depleted plasma were digested in solution and analyzed by LC–MS/MS. (C) Protein abundances were assessed by label-free protein quantification using Scaffold software, and protein kinetics were analyzed based on peptide isotopomer distribution using custom-made software. Networks of protein fluxes were analyzed using Gene Ontology (GO) and Ingenuity Pathway Analysis (IPA).

