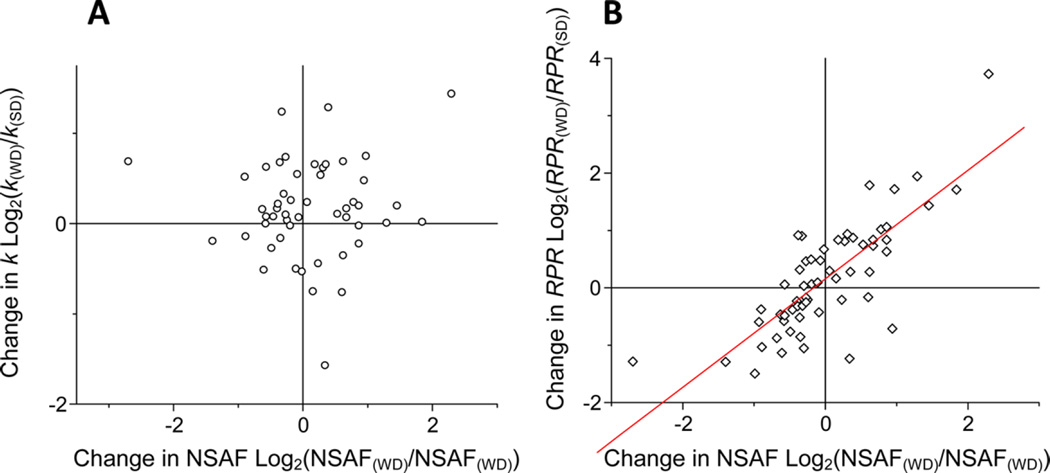
Figure 5.
Relationships between the WD-induced change in the abundance and the change in turnover of plasma proteins. Distribution of the changes in both turnover rate (k) and abundance of each protein (A). Distribution of change in RPR and the abundance (B). The data are derived from Table 1 (means ± SD). There were no correlations between the changes in protein abundance and the changes in turnover rate (k). The changes in the abundance of proteins were directly related to the changes in RPR (r = 0.78, P < 0.0001) (B).

