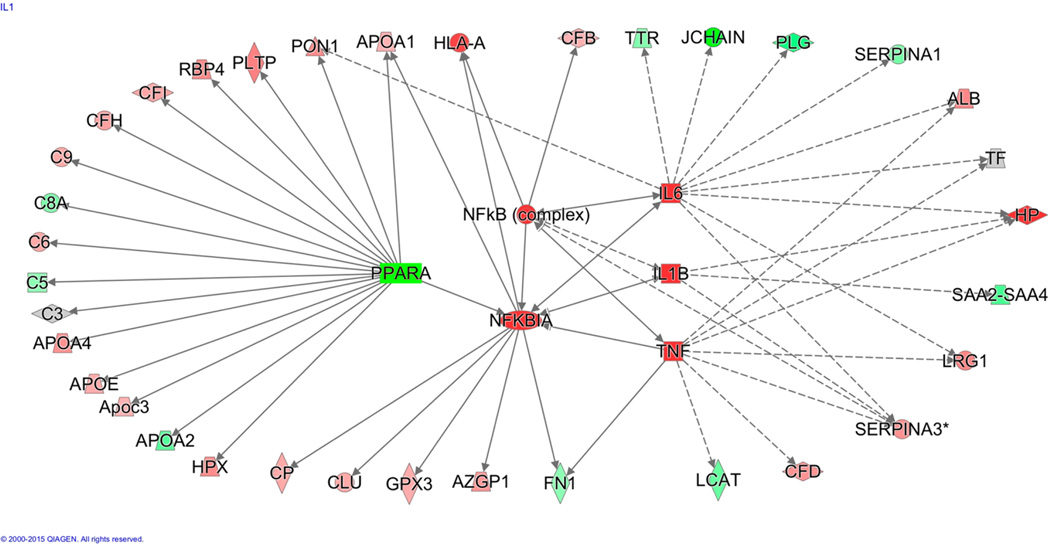
Figure 7.
Effect of WD on dynamic plasma proteome networks. Unsupervised upstream pathway analysis of proteins with measured turnover rate results from the 2H2O metabolic-labeling experiment revealed that observed expression patterns were significantly associated with the suppression of PPARα. The outer circle of proteins was experimentally measured, where a green color represents a decreased k value and red represents an increased k value in WD compared to that in SD. Note that a gray color indicates no change. The activities of proteins (k-values) at the center were predicted to be activated by the upstream analysis as indicated with red color.

