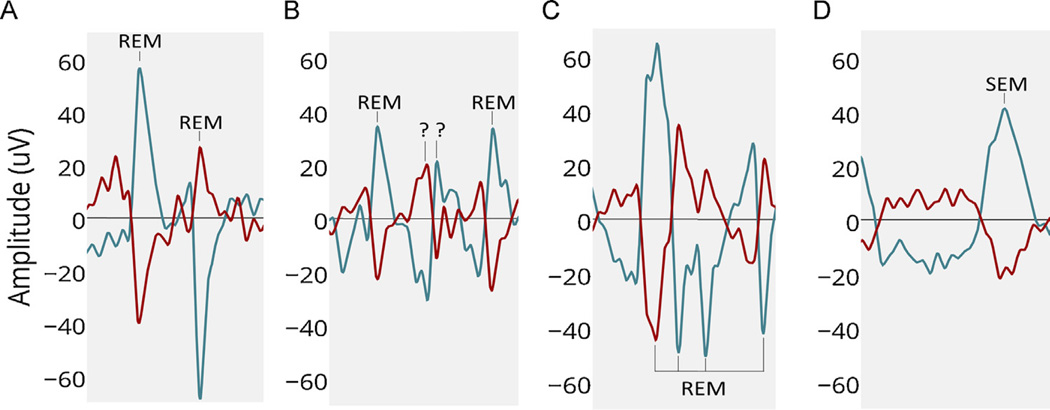
Fig. 2.
Examples of REM waveforms. Y axis represents 3 s (3 windows). LOC in blue, ROC in red: (A). An example of two ‘ideal REMs’ easily detected by simple thresholding (B). Example of REM like movements (?) to be ignored (C). Multiple REMs in close proximity with different amplitudes in channels, requiring a combination of features to detect (D). Slow Eye Movements (SEM) to be ignored.

