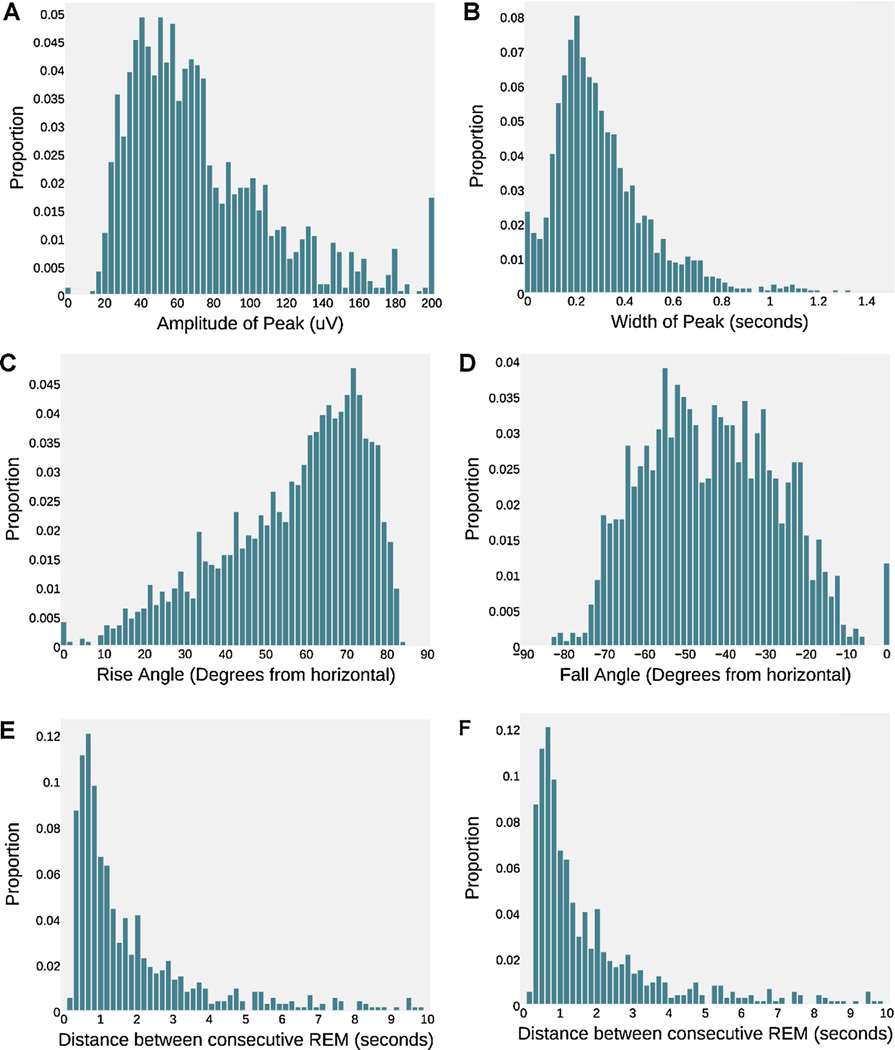
Fig. 4.
REM feature distributions. REM statistics are calculate from windows centered on GS REM peaks. (A) Amplitude of REM peaks. (B) Width of REM peaks, as measured in Section 2.2.4.1. (C) Rise slope, measured clockwise from the horizontal. (D) Fall slope, measured clockwise from the horizontal (note the negative sign). (C) The distance between consecutive REM movements. Distances greater than 10 s not shown. (F) Distribution of REM Spectral Power. Note that the zero width, rise and fall angle are artifacts of our rise and fall angle algorithm.

