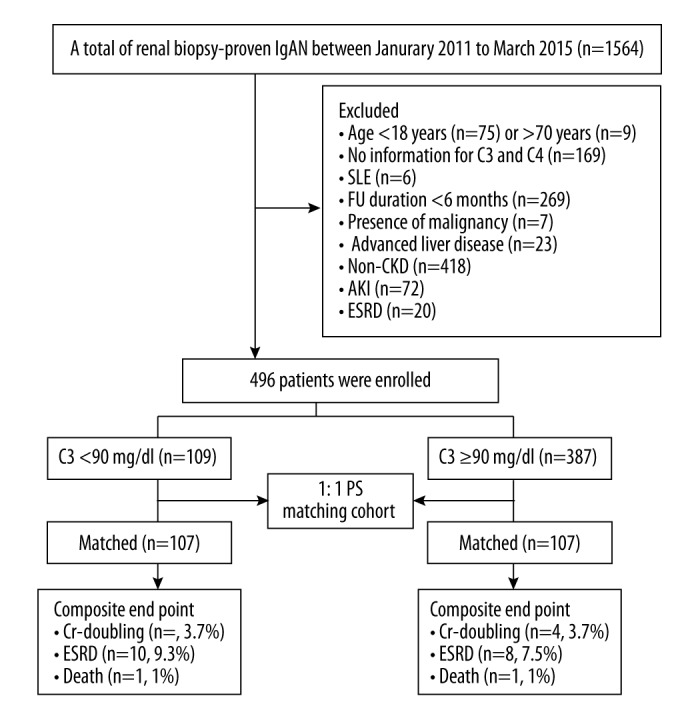
Figure 1.

Flow diagram of patient progress and outcomes. From January 2011 to March 2015, we enrolled 109 patients with decreased serum C3 level and 387 patients with normal serum C3 level. After 1: 1 propensity score (PSM) matching, 107 patients with decreased serum C3 level and 107 patients with normal serum C3 level were ultimately analyzed. Cr – creatinine; ESRD – end-stage renal disease; FU – follow-up.
