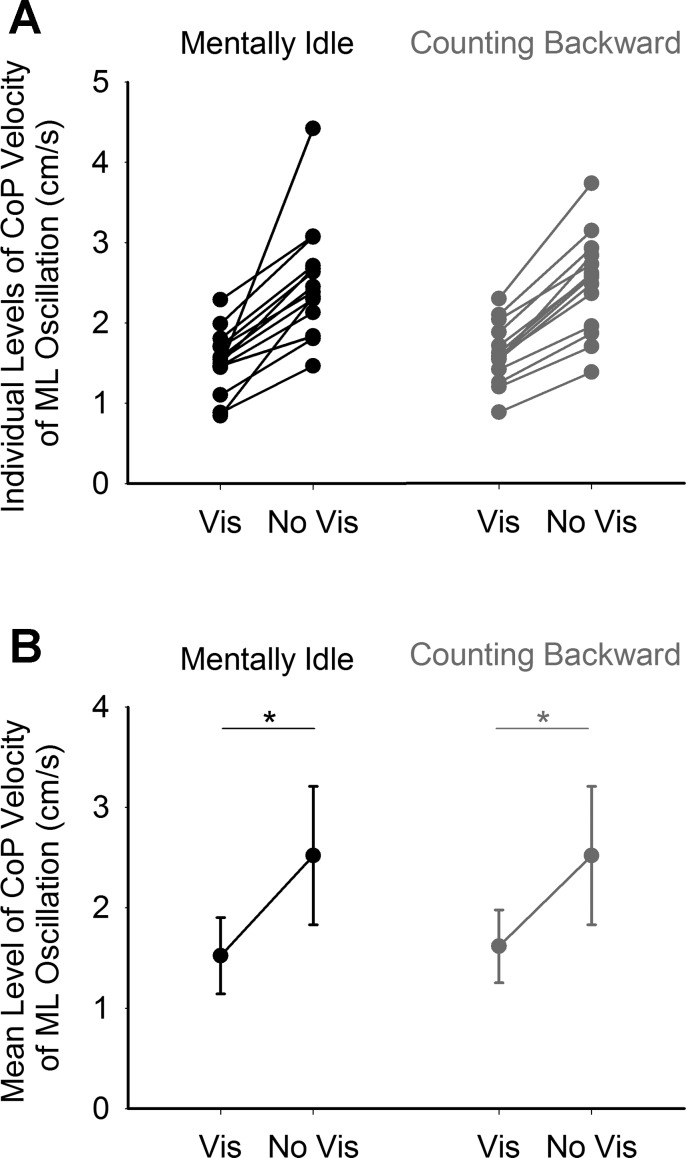
Fig. 2.
Mean level of velocity of ML CoP oscillation. A shows the levels of oscillation velocity of each subject during the presence (Vis) and absence of vision (No Vis) under the mentally idle (black) and counting-backward (gray) conditions. B shows the grand mean and SD of the levels of velocity of oscillation of all the subjects. *P < 0.05 indicates significant difference.

