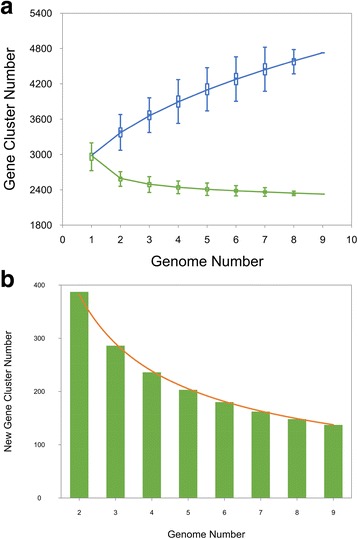
Fig. 2.

Pan-genome calculation of C. glutamicum using nine strains. a Core genes and pan genes calculation. The blue line shows the pan-genome development using, with the asymptotic value of y = 1161× x0.416 + 1821. The green line shows the core genes calculation, with the asymptotic value of y = 1364 × e(−0.802 × x) + 2359, where 2359 is the number of core genes regardless of how many genomes are added into the C. glutamicum pan-genome. b New (unique) genes of the pan-genome. The horizontal dashed line (orange) indicates the asymptotic value with the function of y = 612 × x-0.68. The figures were produced by PanGP
