
Figure 5. NRG1 treatment does not modulate excitatory synaptic input onto pyramidal neurons under normal or monocular deprivation conditions.
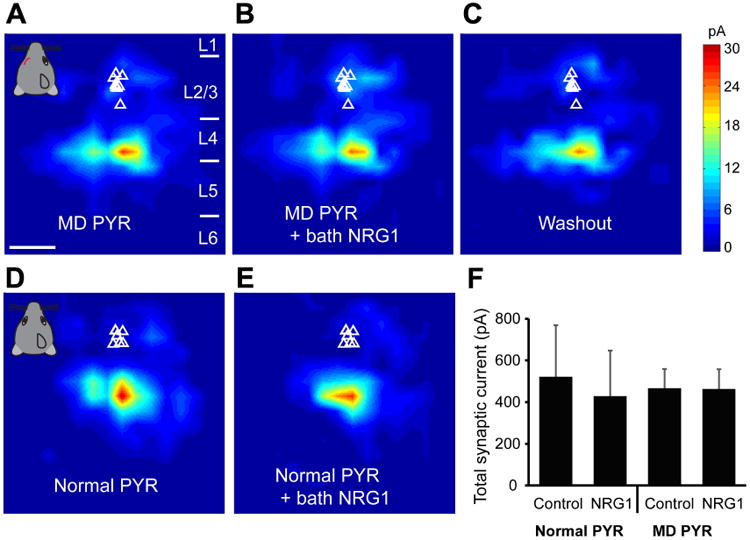
A-C, Quantitative group-averaged, excitatory input maps of monocular deprived (MD) L2/3 pyramidal (PYR) neurons are shown for before (A, n = 9 cells), during (20 minutes after NRG1 application, B) and after washout (C) of bath NRG1. White triangles represent individual pyramidal neurons. The spatial scale bar in (A) indicates 200 μm. Color scale in (C) indicates excitatory input strength. Cortical layers of 1, 2/3, 4, 5 and 6 in the brain slice are indicated as L1, L2/3, L4, L5 and L6. D-E, Group-averaged, excitatory input maps of normal L2/3 pyramidal neurons are shown for before (D, n = 6 cells) and during bath NRG1 (E). F. Summary data of average total synaptic input strength measured for control (n = 6) versus deprived (n = 9) L2/3 pyramidal neurons. There is no significant difference between the groups (p > 0.5, Mann–Whitney U tests).