
Figure 7. During critical period monocular deprivation, NRG1 enhances evoked synaptic inhibition onto pyramidal neurons without altering the strength of PV inhibitory synaptic connections to pyramidal neurons.
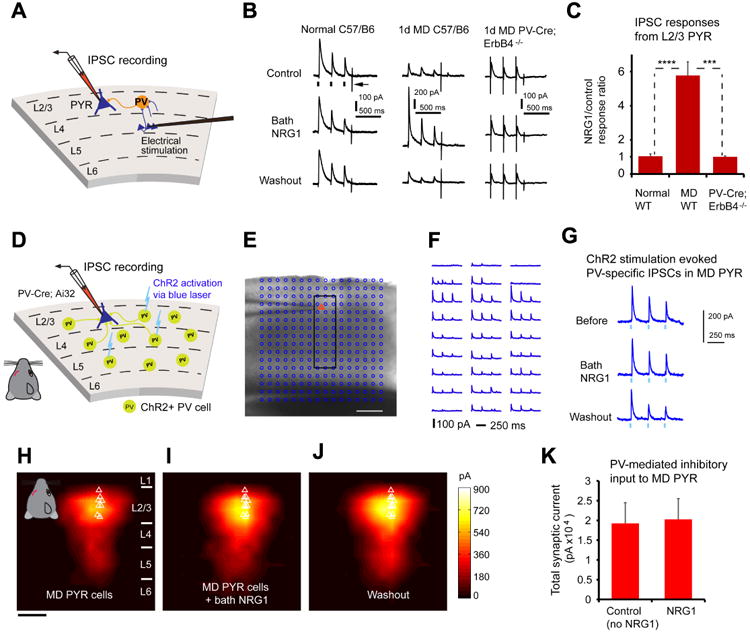
A, Schematic of recording inhibitory postsynaptic current (IPSC) responses in L2/3 pyramidal (PYR) neurons by preferentially activating L4->L2/3 feedforward projections to L2/3 PV neurons through L4 electrical stimulation. B-C, Bath NRG1 increases evoked IPSCs to monocular deprived (MD)pyramidal neurons in slices of wild type C57/B6 mice (n = 16 cells), but not normal pyramidal neurons (n = 6 cells), or pyramidal neurons (n = 5 cells) in slices of PV-Cre; ErbB4flx/flx mice. For each trial, electrical stimulation (1 ms, 20 μA) was applied three times (represented by three black ticks beneath one example trace in B).For the example trace, the arrow indicates the current injection response to monitor access resistance during the experiment. ***, and ****, p = 0.003 and 6.1E-04 (Mann–Whitney U tests). D-K, The responsiveness of PV inhibitory input connections to deprived pyramidal neurons is not modulated by bath NRG1, as assessed with optogenetically evoked PV inhibitory inputs. D, Schematic of mapping PV inhibitory IPSCs to individually recorded L2/3 pyramidal neurons in local V1 circuits in PV-Cre;Ai32 mouse slices. E, A representative mapping grid with ChR2 photoactivation sites (cyan circles) is superimposed to the slice image, and ChR2-evoked IPSC responses from the rectangular region in E to the recorded pyramidal neuron are shown in F. G, Example IPSC responses recorded from the pyramidal neuron shown in (E, F) while directly activating ChR2-expressing PV cells through optogenetic stimulation in one map location before, during and after washout of bath NRG1. The repeated blue laser flashes (0.25 ms) (represented by three blue ticks beneath the traces in G) were applied to each map location. Group-averaged, inhibitory input maps of L2/3 pyramidal neurons are shown for H, before (n = 11 cells) and I, during bath NRG1 (20 minutes after NRG1 application) and J, after washout of bath NRG1. White triangles represent individual pyramidal neurons. Color scale (J) indicates integrated PV inhibitory input strength (black = low, yellow = high). K, Summary data of average total synaptic input strength measured for deprived L2/3 pyramidal neurons (n = 11) for control and bath NRG1. The spatial scale bars in (E, H) indicate 200 μm. There is no significant difference between the groups (p = 0.7, Mann-Whitney U test).