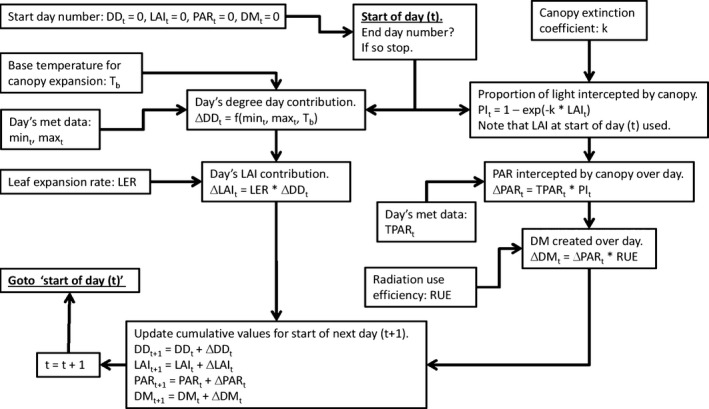
Figure 2.

The mathematical model of Miscanthus canopy development and yield represented as a flowchart. One cycle around the chart steps the model through one day using that day's met data. ▵: value (change) over given day t. DD: thermal time (degree days in °C days). DM: dry matter (gDM m−2 ground). f(mint, maxt, T b): the formula for calculating DD using the daily min and max air °C values and the base temperature for canopy expansion (T b) (Clifton‐Brown et al. (2000)). k: canopy extinction coefficient (m2 ground m−2 leaf, i.e. dimensionless). LAI: leaf area index (m2 leaf m−2 ground, i.e. dimensionless). LER: leaf expansion rate which is the degree day to LAI conversion factor (LAI °C day−1, or °C day−1). If a genotype has more than one growth phase, then this value may be switched to a different one once a threshold cumulative DD value has been reached. Maxt: maximum air temperature on day t ( °C). Mint: minimum air temperature on day t (° C). PAR: photosynthetically active radiation (MJ m−2 ground). PI t: proportion of the PAR hitting the top of the canopy that is intercepted by the canopy on a given day (dimensionless). RUE: radiation‐use efficiency (gDM MJ −1 intercepted PAR). t (subscript): day number in year. T b: base temperature for canopy expansion ( °C). TPAR t: total PAR hitting the top of the canopy over day t (MJ m−2 ground).
