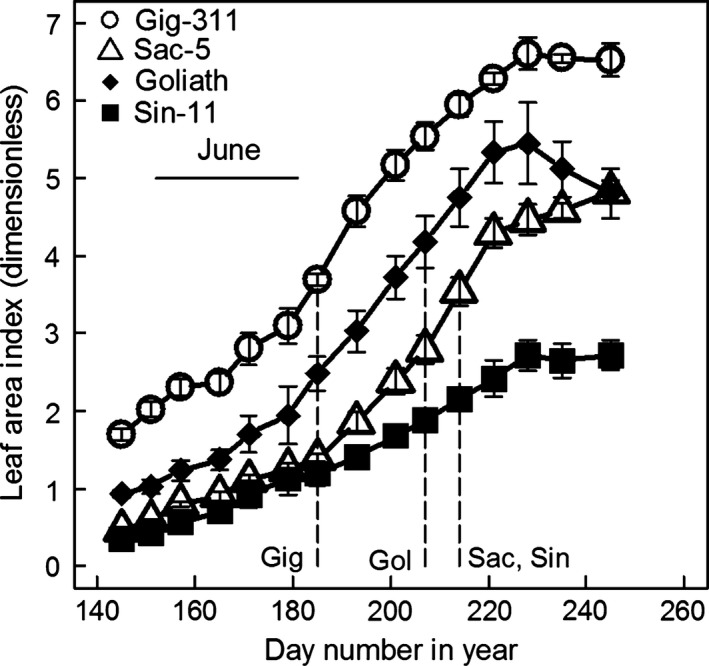
Figure 4.

The mean LAIs across the replicate trial plots for the four genotypes (in 2011) vs. day number in the year. The error bars are plus‐and‐minus one standard error of the means. The vertical lines show when the canopies first intercepted 90% or more of the incident PAR based on the LAIs and the fitted k values. The horizontal bar indicates June which has the peak in the annual PAR levels.
