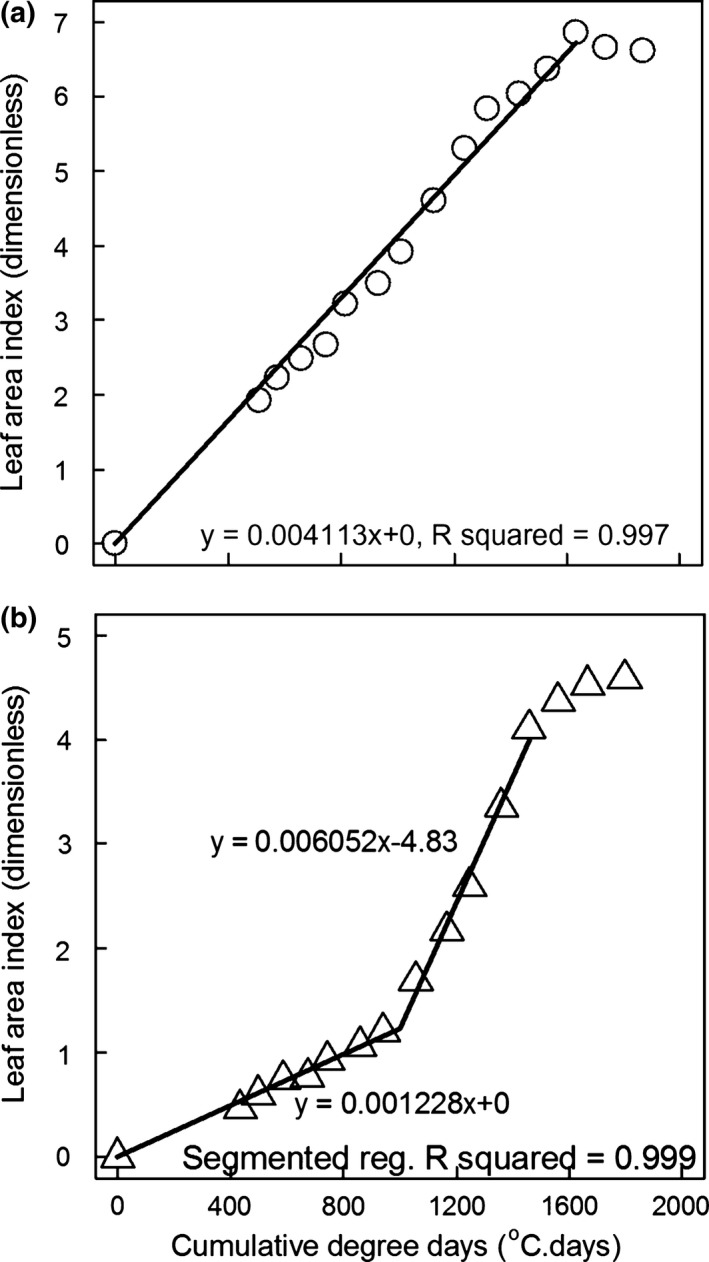
Figure 6.

Measured LAI vs. cumulative degree days calculated using a T b of 0 °C and with the LAI and degree days equal to zero on the day when the first leaves with ligules appeared (stage FLL day). Example data from individual trial plots are shown for two genotypes demonstrating the fits to the two models used: a single linear regression line ((a) Gig‐311) and segmented regression with two linear sections and one breakpoint ((b) Sac‐5). The slopes of the lines were used to estimate the LAI °C day−1 (leaf expansion rate: LER) values. The later season ‘plateau’ LAI values were not used in the fits.
